3 weeks ago, I had a look at the bbry charts and see what was up. Check out this previous post.
Here is a small update. The monthly candle chart is still in an ascending triangle formation.

The weekly candle chart shows the lower ascending trend line getting close to being tested again.

The detail on the daily candle chart shows a tight range closing in on that support line.
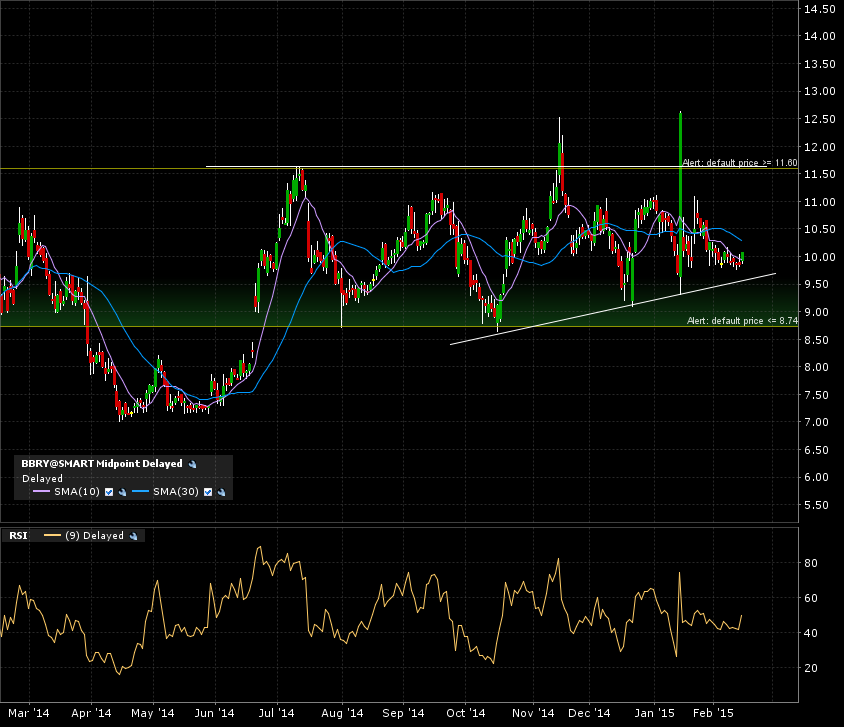
Remember, the longer the breakout line is tested, the more the sellers are drying up. Same is true for a tested support line, the buyers are dried up and the level breaks.
The more time this takes to break, the stronger the push will be in that direction. Patience required.