Guggenheim Solar (TAN:ARCA) has been consolidating nicely in a BIG +3 years base. Check out the monthly candle chart.
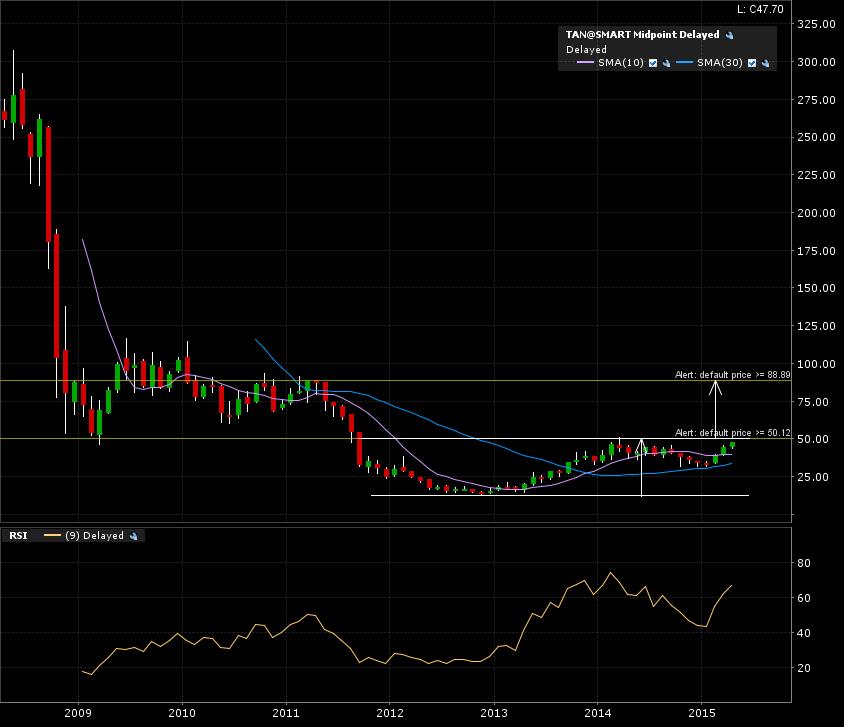
The 5 year weekly candle chart shows the implied measured move back to previous resistance at the 89 mark.
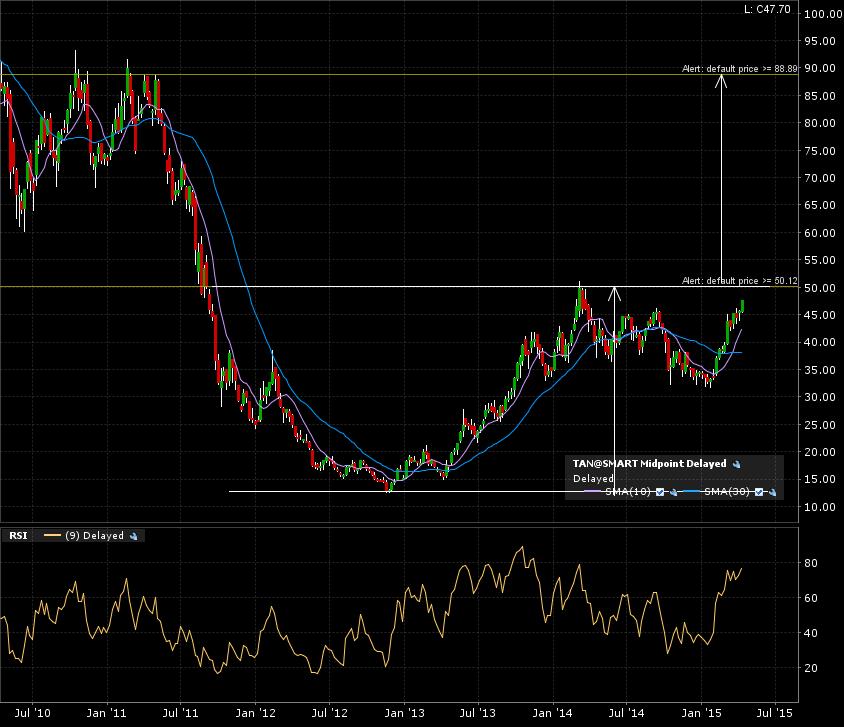
Zoom in on the 1 year daily candle chart shows the price action making a run to test the breakout line (resistance) at 50.

I set my alert. A monthly candle close above 50 will confirm the next move. No WALLS (important resistance on the way to target) visible. I believe this adds value to the probability of the possible target to be reached.
Remember to use sound risk and money management for all your trades. Check my “How To”.