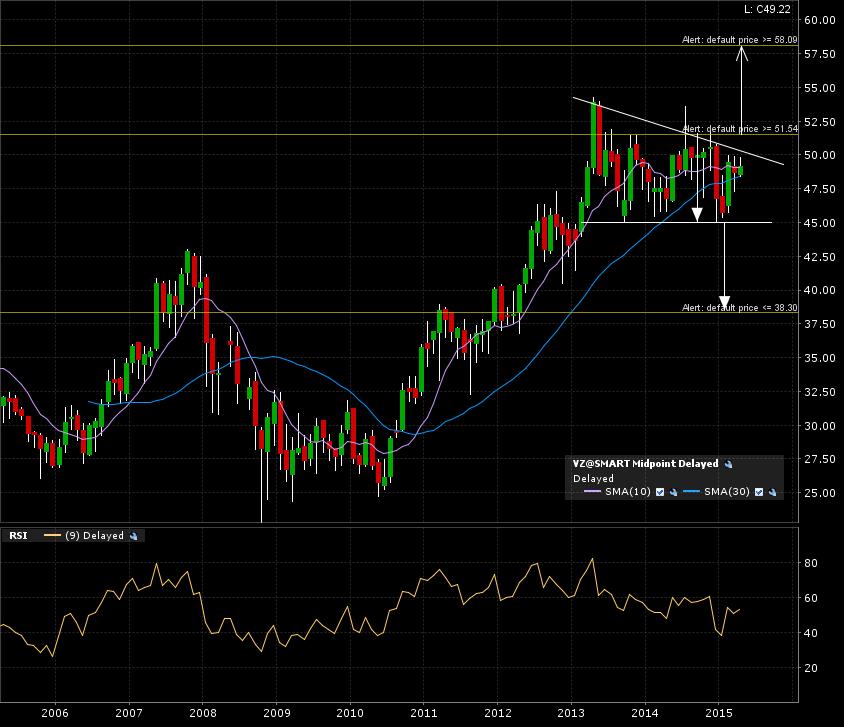
Verizon Communications Inc. (VZ:NYSE) has been consolidating for +2 years. This could end up being a top formation OR a continuation pattern. I have arrows marked for either case. Check out the monthly candle 10 year chart.
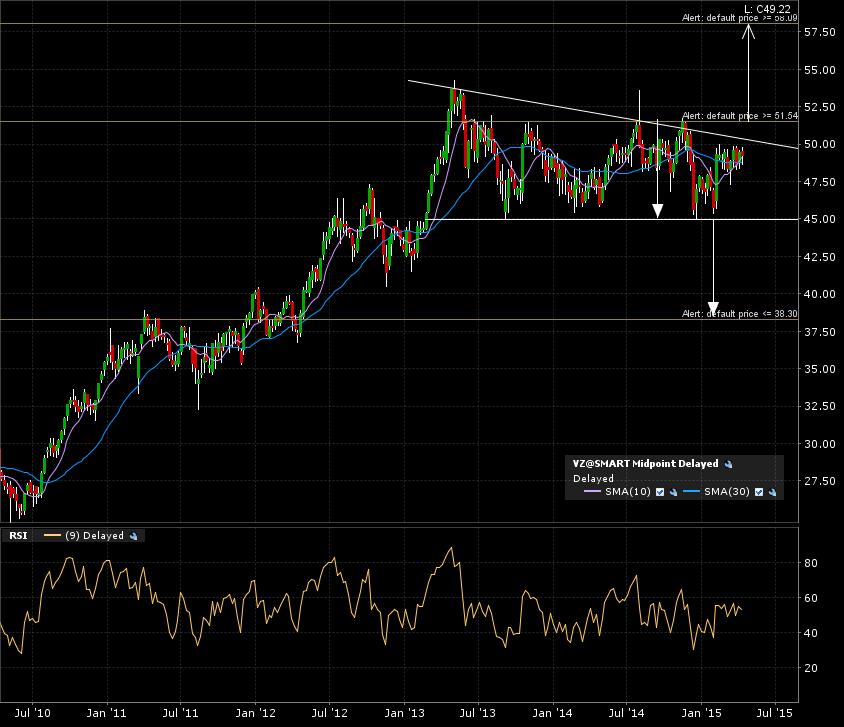
The weekly candle 5 year chart shows the breakout and breakdown lines.
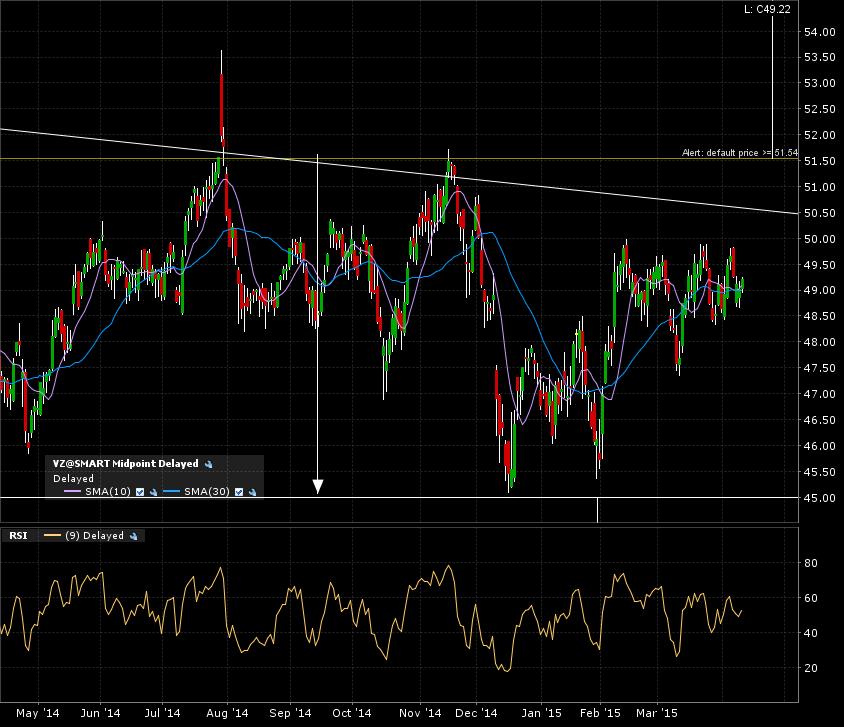
Zooming in on the daily candle 1 year chart shows the price action in no man’s land.
Although the price is getting closer to testing the upper resistance breakout line, the moving averages seem to be rolling over on the monthly candle chart. Monthly candle charts represent the prevailing trend. The smaller time frames mostly represent noise within that higher time frame.
I set my alerts at 51.50 for the bullish breakout AND at 45 for the bearish breakdown. Assuming a monthly candle close above or below those break lines for confirmation, the ensuing targets would be 58 (bullish) or 38 (bearish).