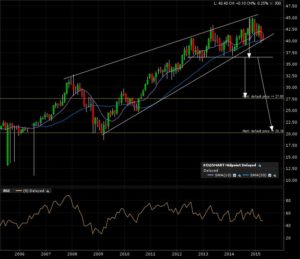
The Coca-Cola Company (KO:NYSE) isn’t KO’d yet, but the charts are showing some bearish reversal/top patterns. Check out the 10 year monthly candle chart. There is a HUGE 7 year “rising wedge” classical chart pattern in the works.
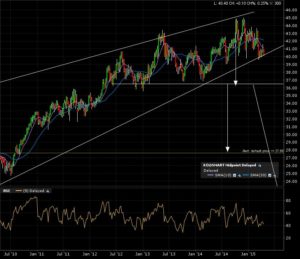
The 5 year weekly candle chart showing the price testing the ascending lower boundary trend line. I prefer plating breakdowns or breakouts on horizontal breaks, I believe this adds value to the probability of reaching my possible target.
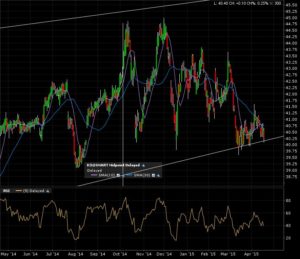
The zoom in on the daily candle 1 year chart show more of the recent tests of the lower boundary.
My alert is set at the 37 level. A monthly candle close below that level would give the a close target of 27.50. The REAL target is the retrace back to the start of the “rising wedge” classical chart formation of 20.


