I was scanning some charts this morning, and fell on the Volatility Index. That is one noisy chart. First. go check out this previous post on how to reduce noise.
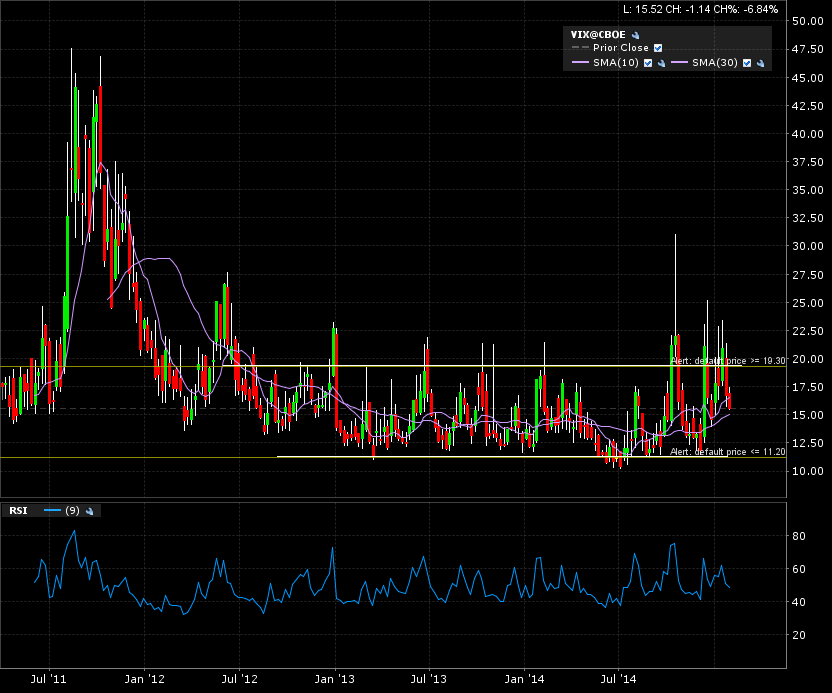
Here we go. Just the daily candle chart has some breakout candles that could whipsaw you into kingdom come! I’m counting about 5 false breakouts in that 1 year period.

Now the weekly candle chart has reduced some of those breakout candles, but there is still many false breakouts on that 4 year span.
Enter the monthly candle chart to the rescue! Drawing that support and resistance line to the close of the candles, you now have almost no more false breakouts. We now have a solid +2 year base with clear breakout lines.
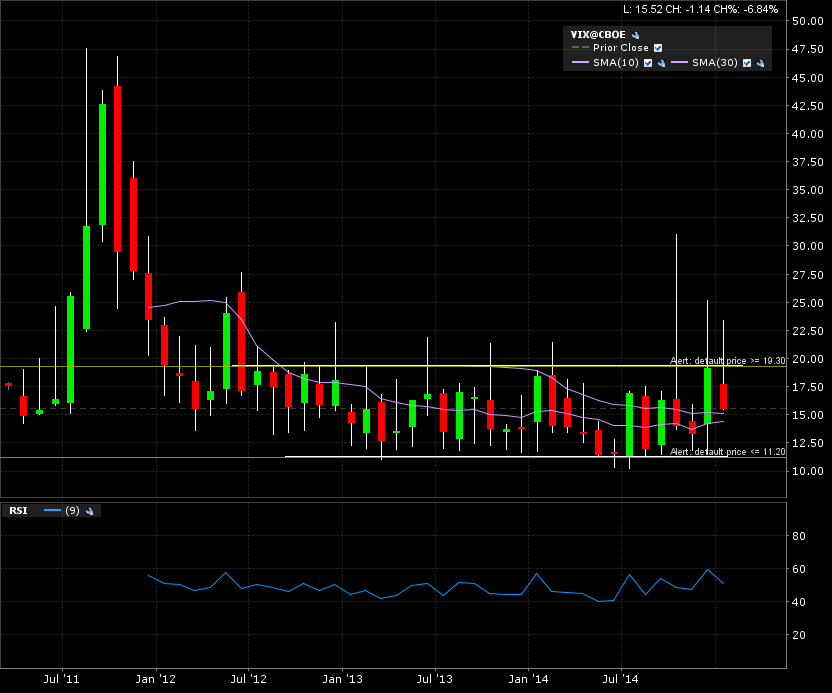
That is where my alerts are set. A monthly close above 19.30 or below 11.20 will get my attention. So that is about it, try limiting the number of whiplashes and you will help reduce some unnecessary drawdowns.