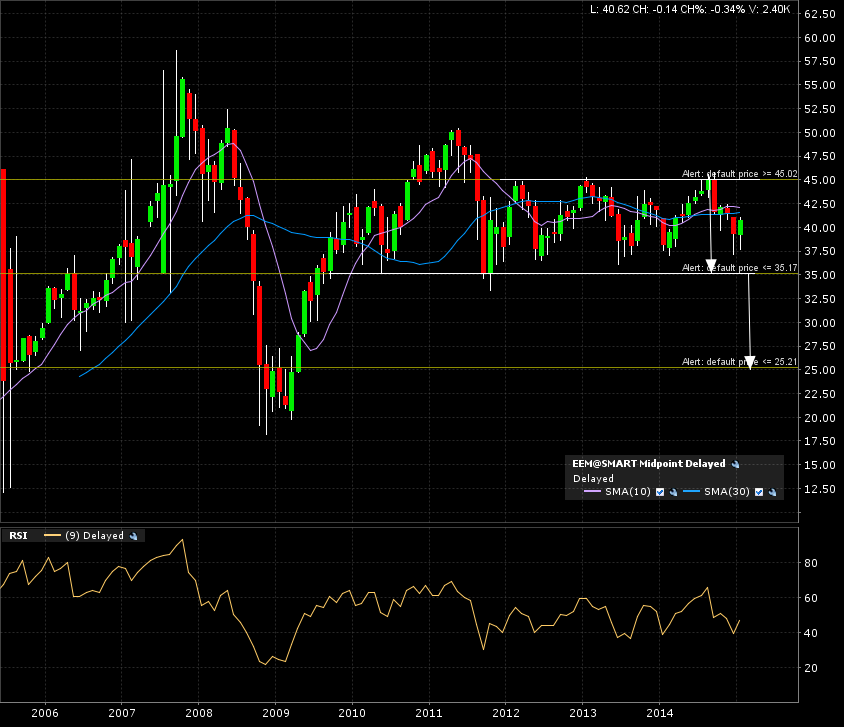
ISHARES MSCI Emerging Market ticker EEM is drawing out a 3 year consolidation rectangle.
The monthly candle 10 year chart shows this top formation. The arrows indicate he measured move, if the formation breaks down below 35.
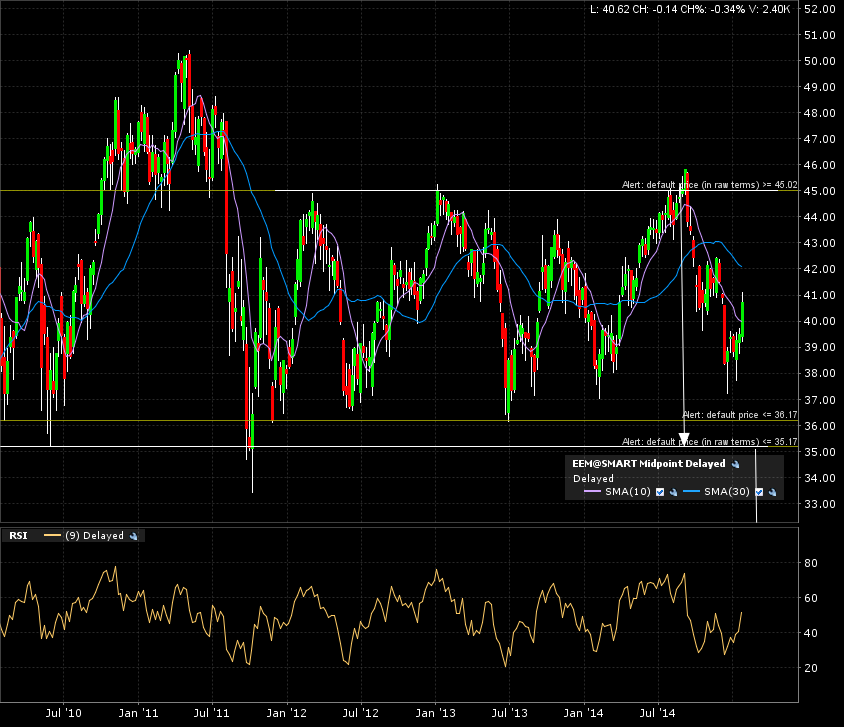
The weekly candle 5 year chart actually shows us there is a tighter formation within the bigger one. I put an alert at 36. This will bring my attention back to this ticker.
The daily candle 1 year chart shows a bounce off the top resistance. Seems like it’s in no-man’s land right now.
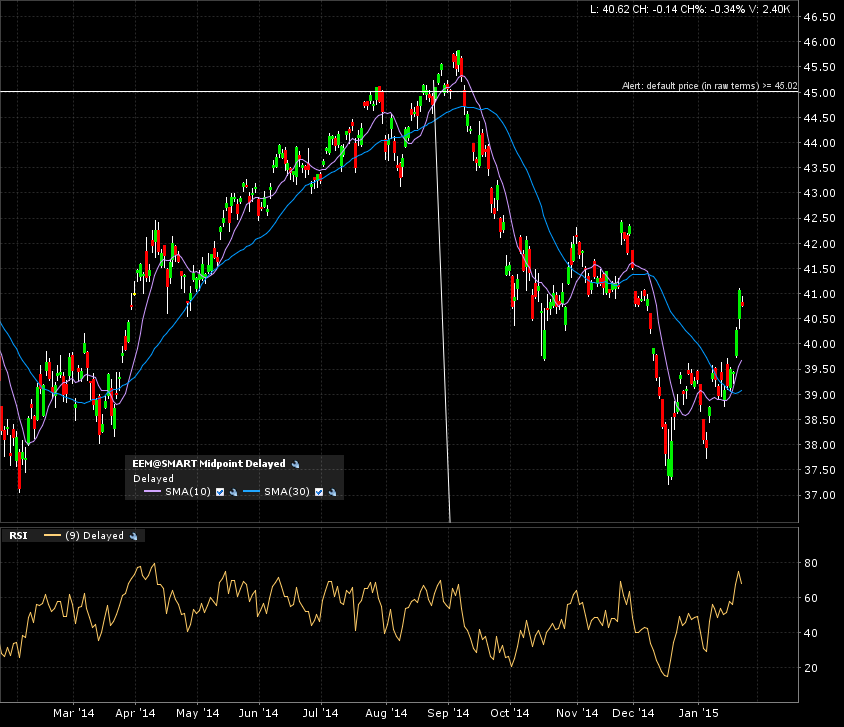
I like these horizontal consolidation patterns. Especially those +years in length. The longer the base… the higher in space… I know, I know.