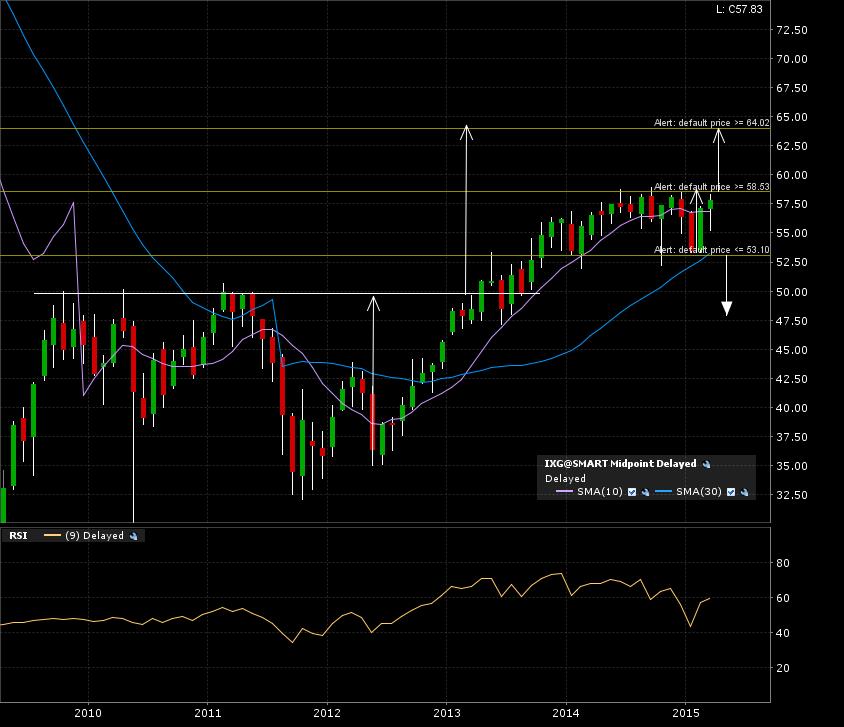
ISHARES Global Financials ETF has been consolidating for the past year and is testing the breakout line (resistance).
A confirmed breakout will give a target coinciding with the current target from the previous BIG 4 year base. Here is the 6 year monthly candle chart.
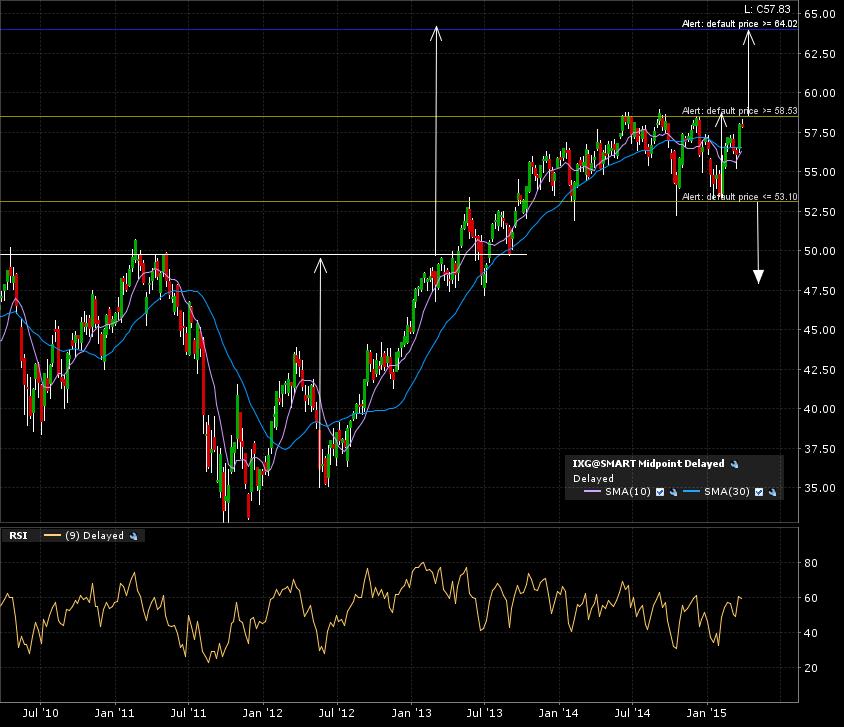
The 5 year weekly candle chart shows the multiple test of the breakout line at the 59 mark.
Zoom in on the daily candle 1 year chart. The price action is making a run towards the breakout line. A couple more days to go…
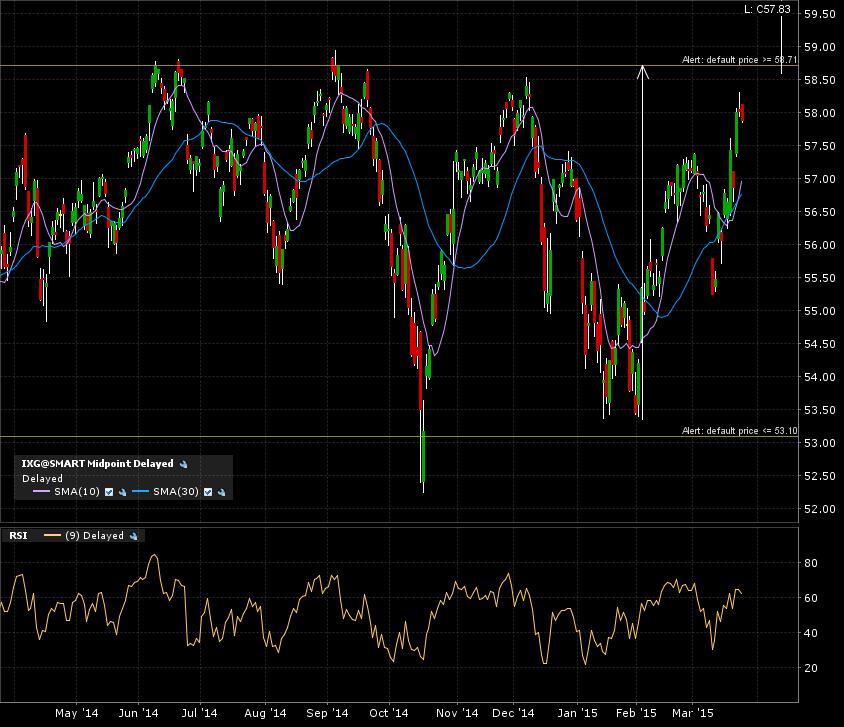
I set my alert at 58.50 and will wait for a monthly candle close above it. This would confirm the continuation target of 64. There is always bearish case to be made, but we are far for now. A break below the 53 mark would give an immediate target of 47.50
Just need to wait a little while longer…