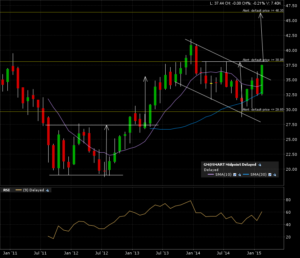
Some hope for General Motors which seems to have exited it’s monthly candle +1 year descending channel.
I’m now looking at the important resistance at 38. It is also the breakout line for the next bullish target. Here is the monthly candle chart (4 years).
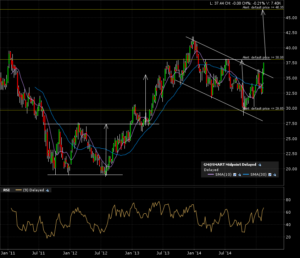
The weekly candle chart (4 years) gives us more detail on the approach to the 38 mark. Arrows show the implied measured move once the formation broken with a monthly close above it. Notice there might be some turbulence at the 42 level (previous high) IF the breakout occurs.
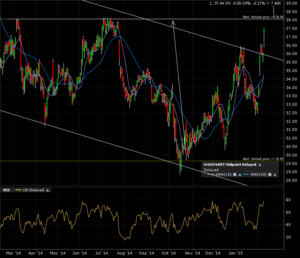
The zoom in on the daily candle 1 year chart gives us a clearer view. Just a few days to go before we get to test the resistance line at 38.
My alerts are set. Will come back to this and see what’s happening once triggered.


