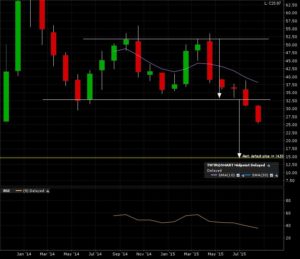
Breakdown in progress for Twitter (TWTR:NYE). A monthly candle close below 32.50 will give the next measured move applied to the breakdown line for a 15 target. Check the monthly candle chart below.
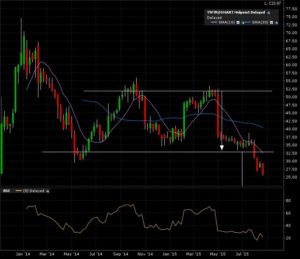
Here is the weekly candle chart. Clearer view of the classical chart pattern formation known as the rectangle (continuation).
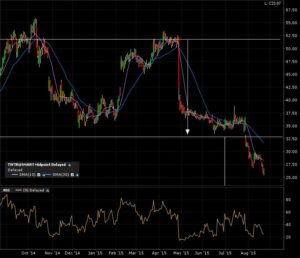
A final zoom in on the 1 year daily candle chart. Nice gap down below the breakdown line. A+ material.
Like a lot more trading instruments this past week, will need to wait September 1st for the August monthly candle close to confirm all these breakdowns. Just a little more patience required.


