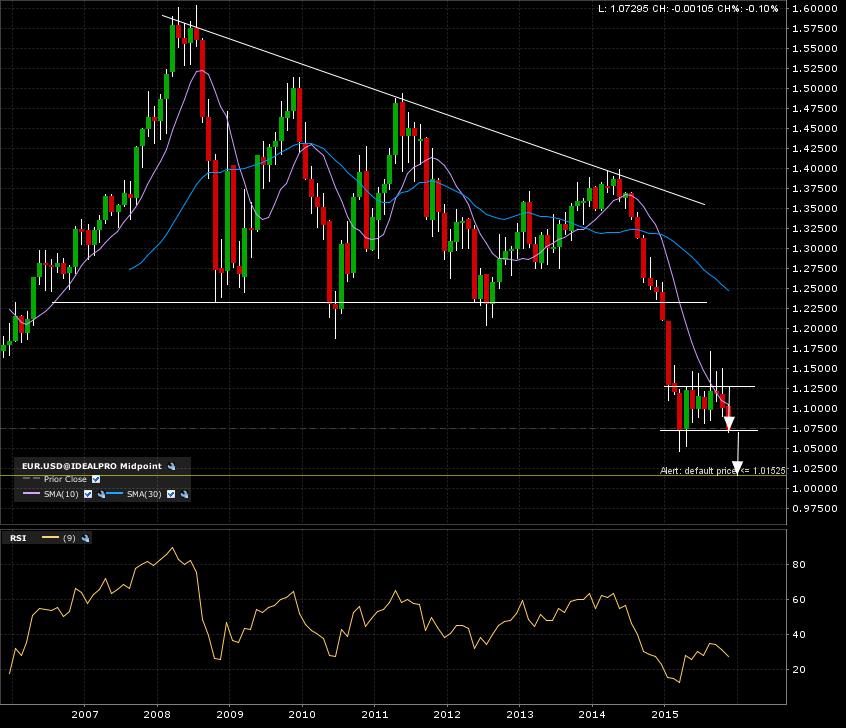
The mostly looked at forex currency pair eurusd is testing it’s 9 month bearish consolidation pattern break line (support). A monthly close below 1.075 would give a nearby target at 1.015. Check out the 10 year monthly graph below.
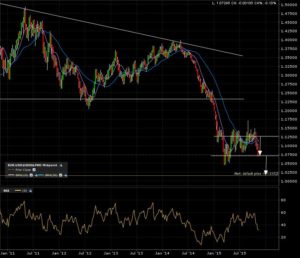
The 5 year weekly candle grach shows some noise below the breakdown line. Make sure to wait for a monthly close below the breakdown line to avoid a possible whipsaw. Check this previous post on how to reduce noise.
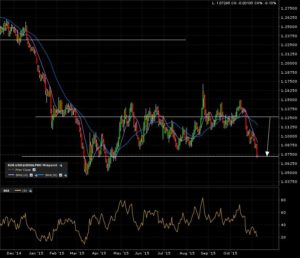
A final zoom in on the 1 year daily candle chart. Testing of the support area in progress. Same noise below the breakdown line as on the weekly candle chart. Be carefull!
I’m definately going to come back to this major forex pair early decembre. Let’s hope I get my bearish continuation breakdown to the furthest target at parity. Check this previous post from Jan 11.