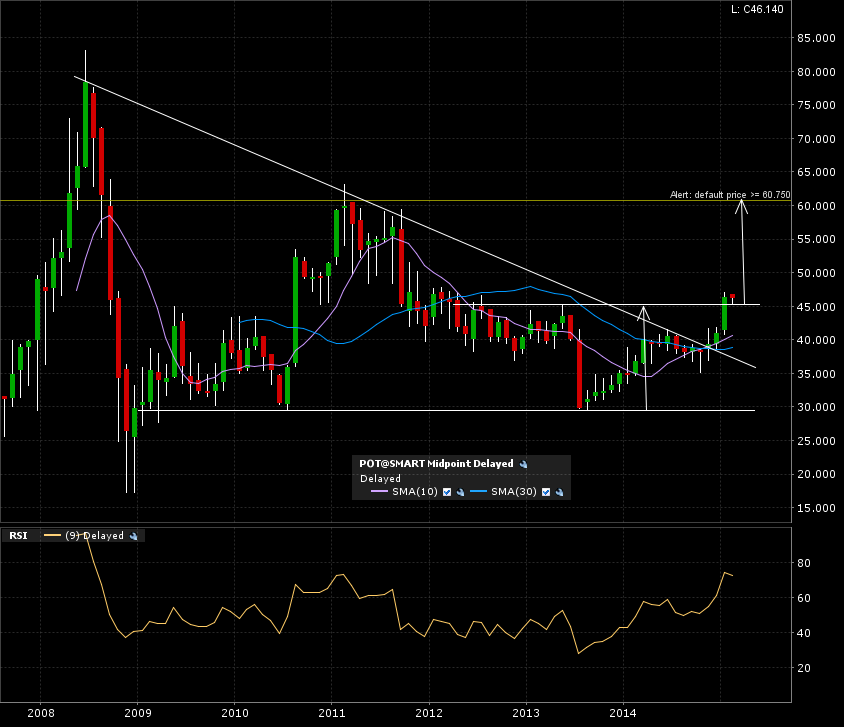
Potash Corp. might just of broken out on the monthly candle chart (6 years). The arrow is the implied measured move added to the breakout line at 45, bringing the target to the 60 mark.
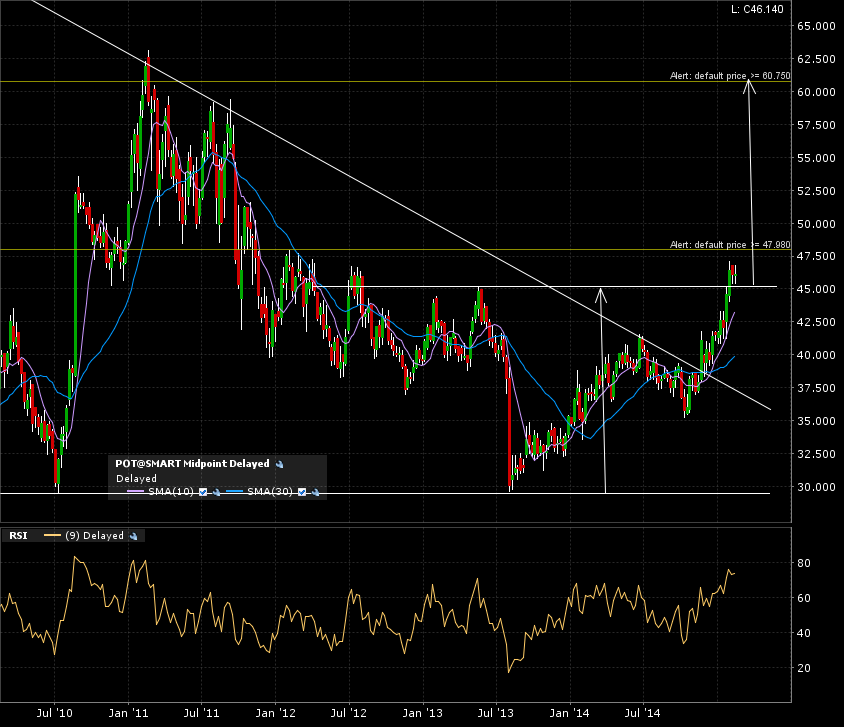
The weekly candle 5 year chart shows the breakout. Notice some early resistance around the 48 mark. If you are not in already, you might want to wait for this congestion to resolve before entering.
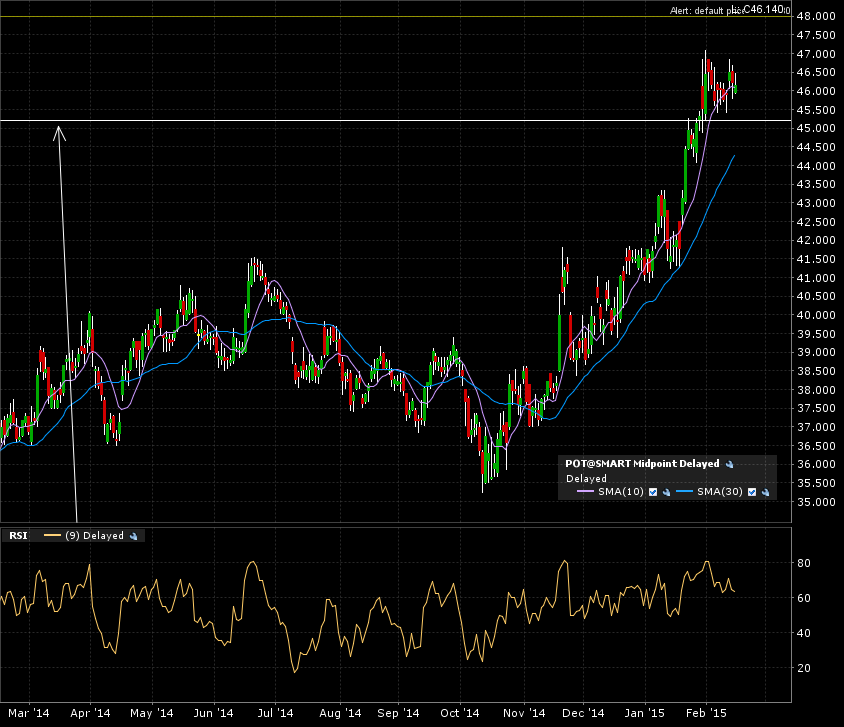
The zoom in on the daily candle 1 year chart shows the price breaking out and approaching the next resistance at 48.
So we have a BIG +3 year base breaking out for pot.ca. Time to watch it grow!