Got a friendly request to check out Encana (ECA:TSE). Let’s do it!
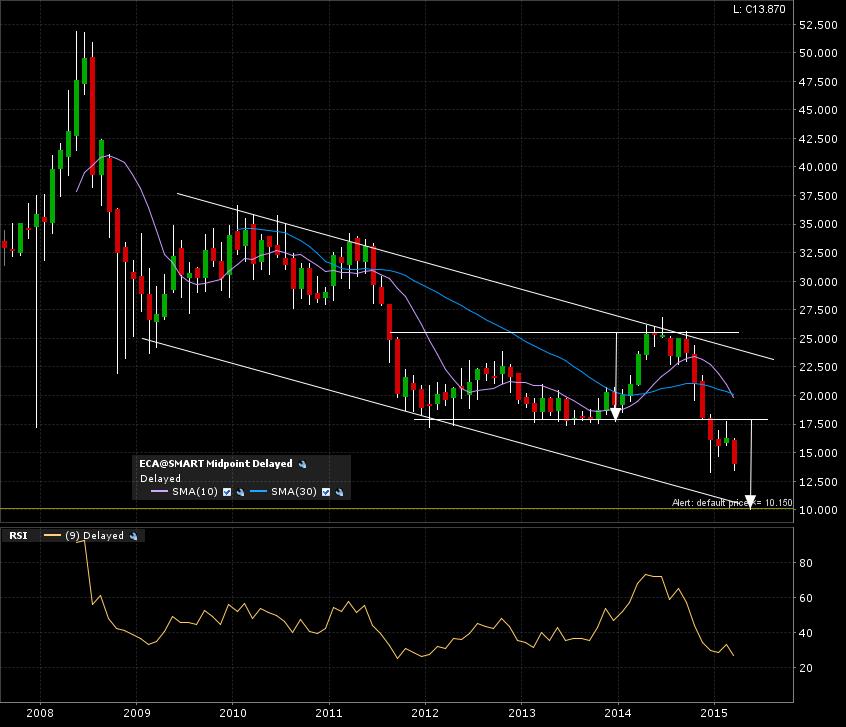
Here is the monthly candle 8 year chart. HUGE descending channel with a breakdown confirmed. Target 10.
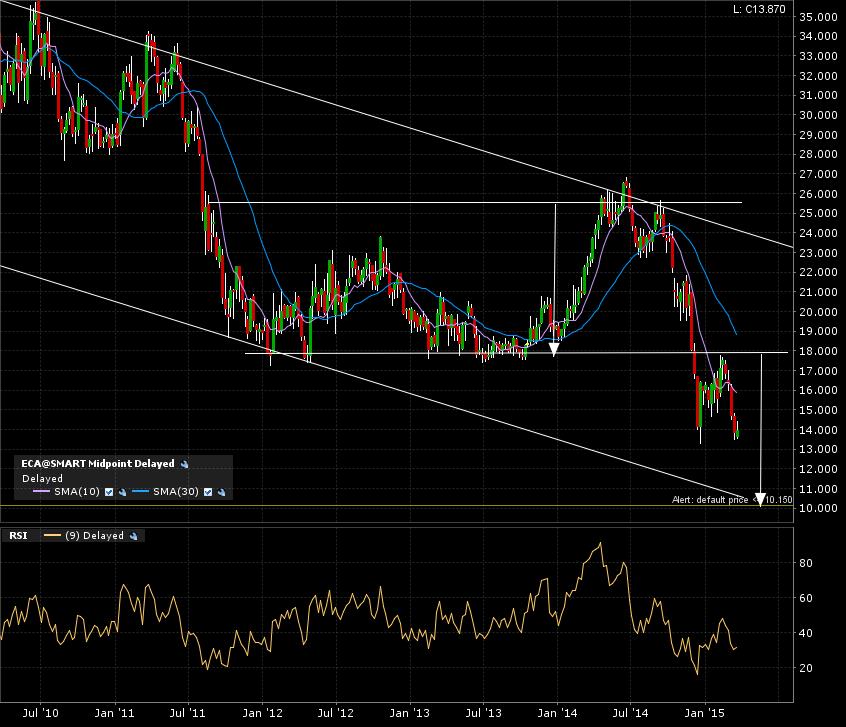
The 5 year weekly candle chart shows the recent retest of the breakdown line now turned resistance at 17.50.
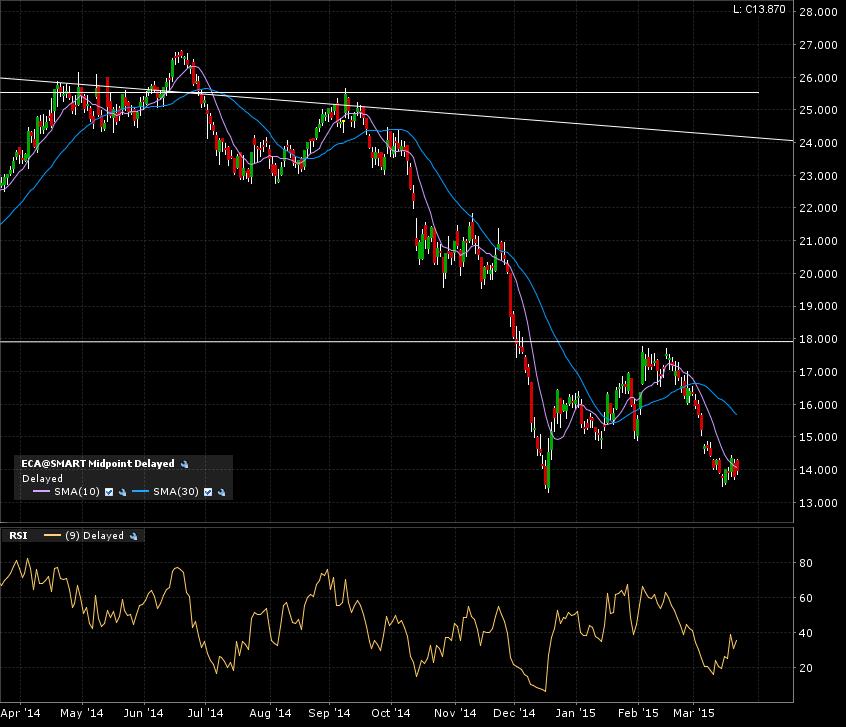
Zooming in on the daily candle 1 year chart, we see the price action testing the previous lows.
There is some turbulence on the way to target. I rather when the target is reached rapidly after a confirmed breakout. In those times of doubt, I like to go back to the higher time frame charts and see if the prevailing trend is still in direction of the target.
Breathe and remember, the trend is your friend!