Toyota Motors (NYSE:TM) is in progress of breaking out. Here is the monthly candle chart. You can see a previous breakout reach it’s target, now we are in the next leg up.
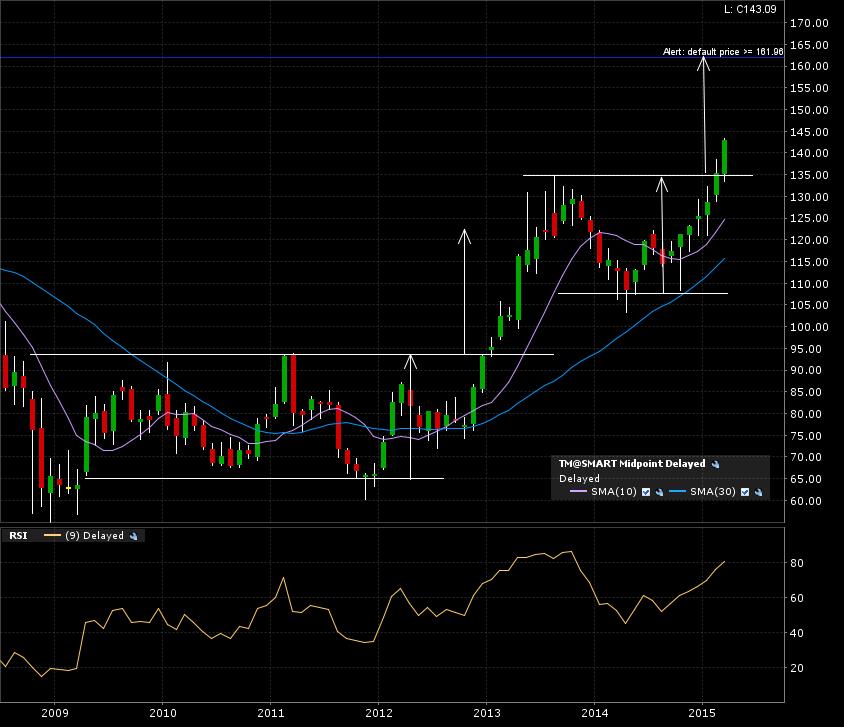
The weekly candle 5 year chart show the weekly candle closing above the breakout line. This could still be noise, that is why I’m waiting for the monthly candle close before confirming this breakout.

Zoom in on the daily candle 1 year chart. The price action is already on it’s way to target!
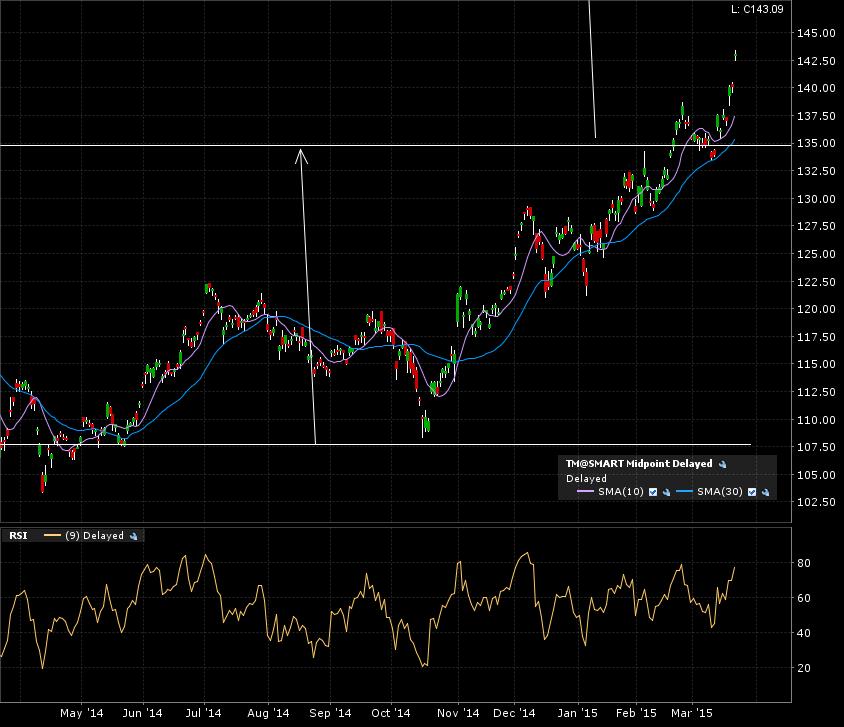
If we get a monthly candle close above 135, the target of 162 is valid. Will come back to this chart early April.