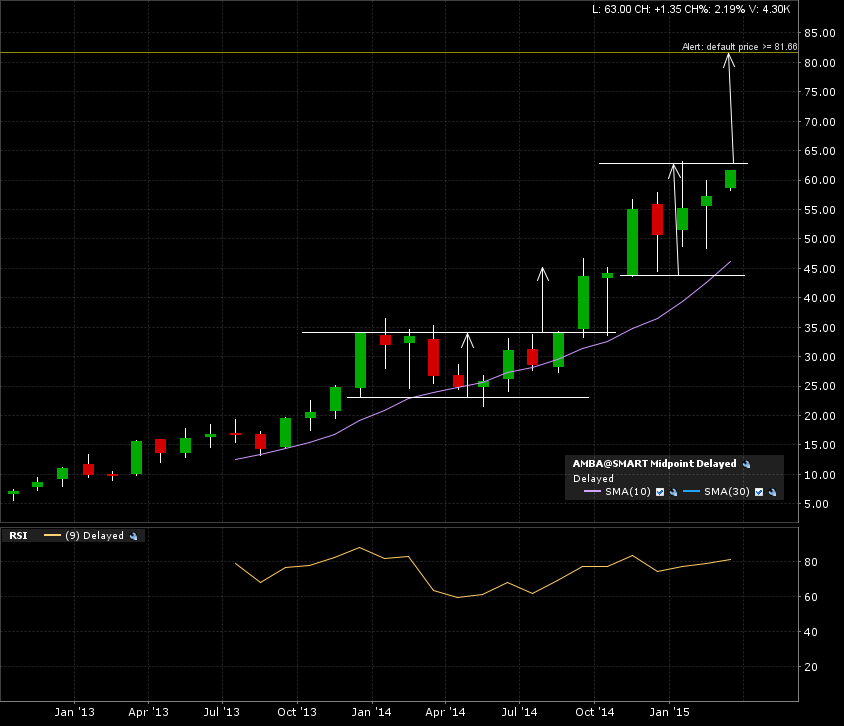
Here is the monthly candle chart (+2 years) for amba. We can see the previous consolidation rectangle breakout and reach the implied measured move applied to it’s breakout line. Now we have a smaller continuation consolidation pattern approaching the breakout line (resistance).
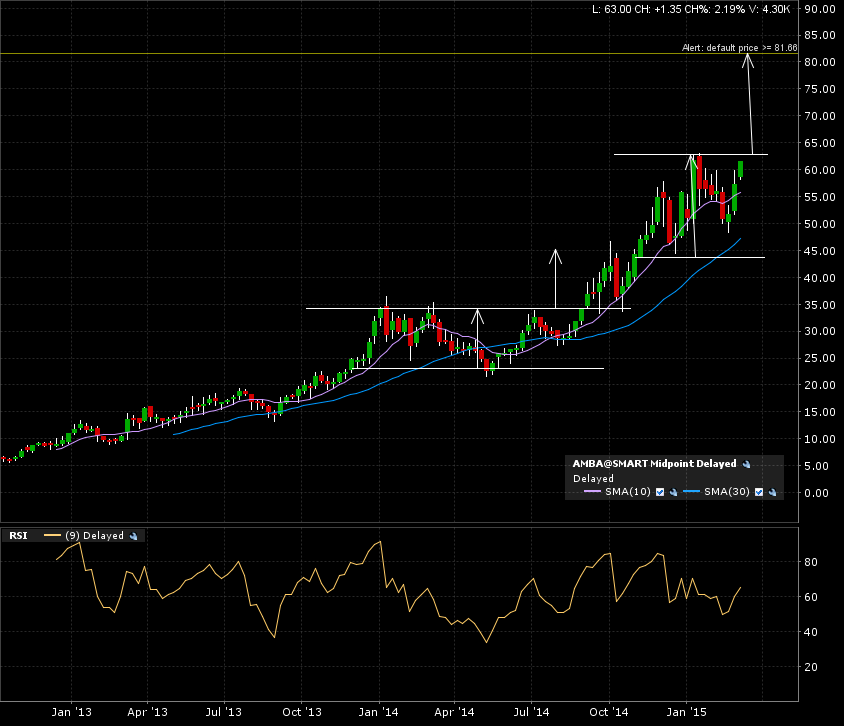
The weekly candle chart show the approaching price action to the 62.50 breakout line mark.
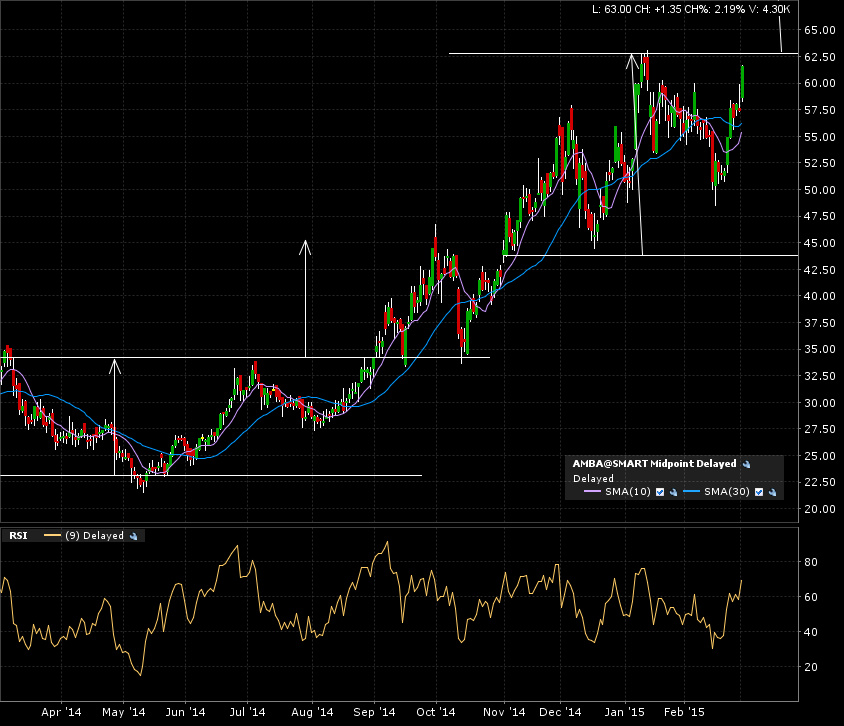
Now the zoom in on the 1 year daily candle chart. Pretty clean, low noise chart. A+ material.
Right now, I’m looking for a bullish continuation for amba. I set an alert at the 62.50 level and will come back to this chart once triggered. IF a monthly candle can close above that level, the implied measured move give a target of 82.