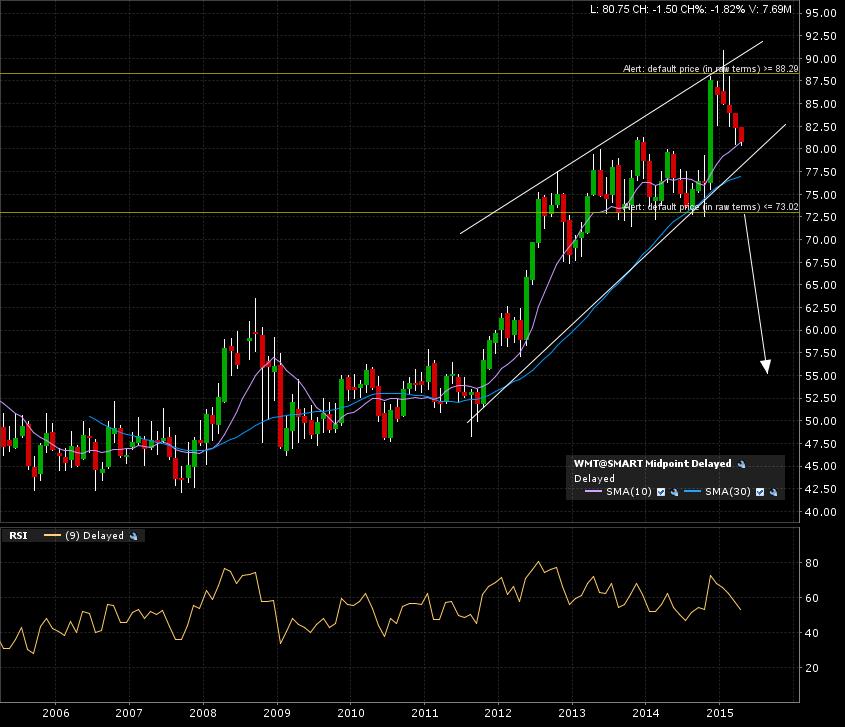
Walmart (WMT:NYSE) might of hit it’s top just a few months ago. A falling wedge classical chart pattern is presently in the works. Check out the 10 year monthly candle chart.
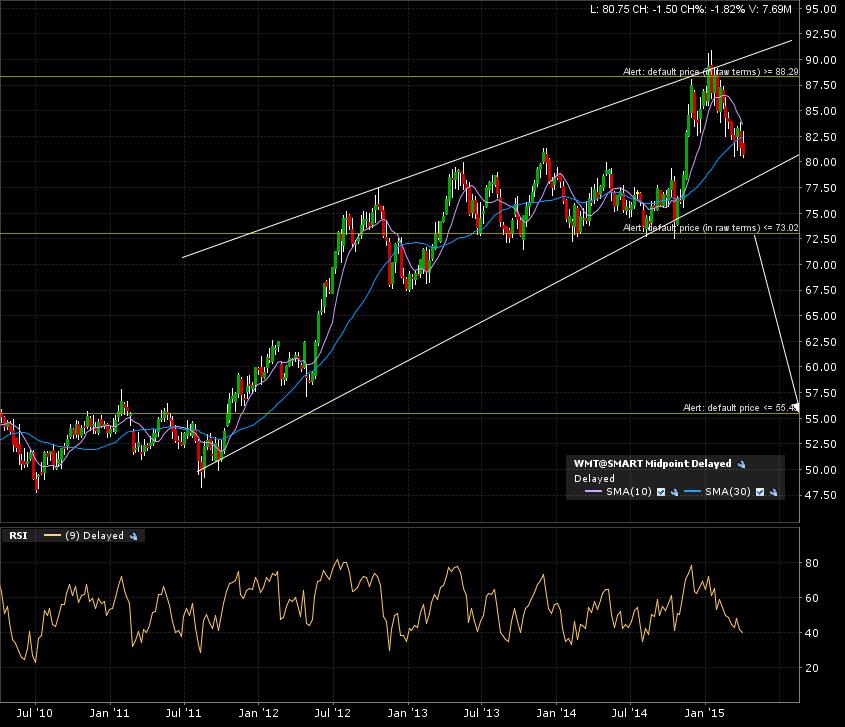
Here is the weekly 5 year candle chart.
And finally a zoom in on the 1 year daily candle chart. Price action trending towards a test of the lower support ascending trend line for the falling wedge pattern.
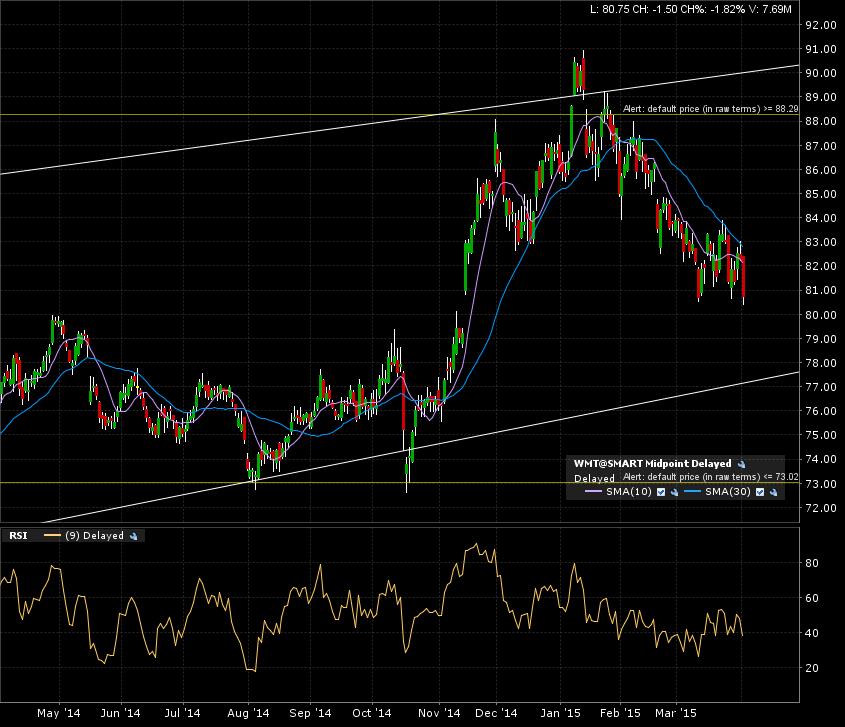
I set an alert below the important support line which will serve as the breakdown line for the formation. I give more value to horizontal support lines than diagonal, so I’ll be waiting for a monthly close below 73 before confirming the breakdown.
Target that would ensue is 55 which is also the previous resistance turned support after the Jan. 2012 breakout.