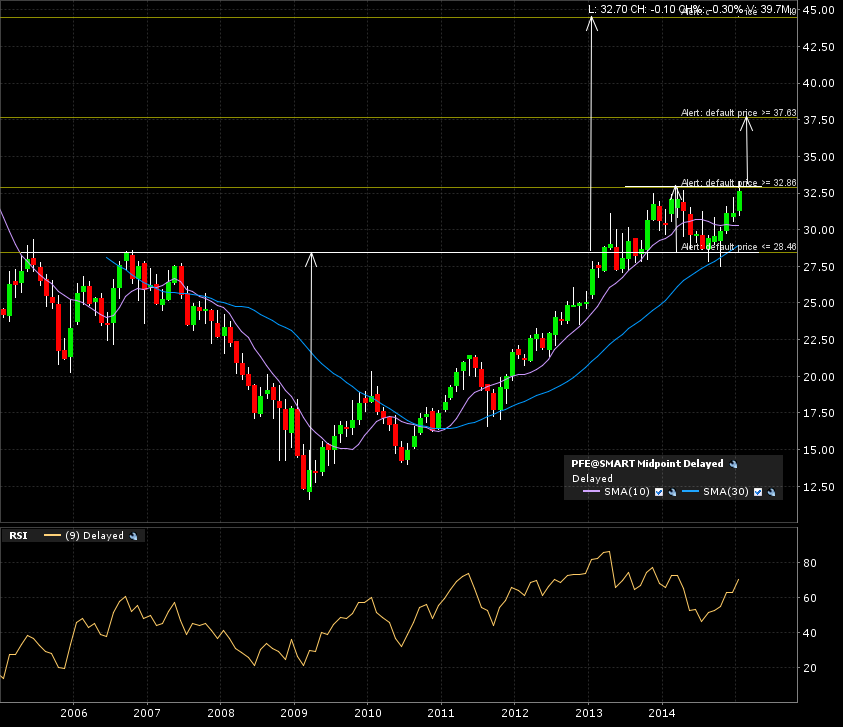
Check out this huge multiple year base with launching formation (+1.5 years) on the monthly candle chart. The arrows are the targets.
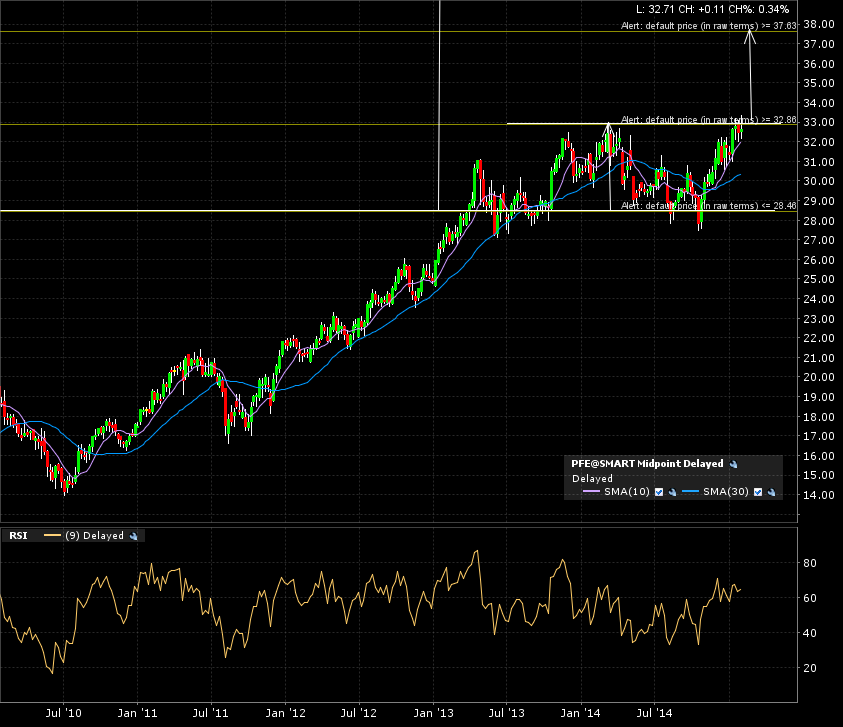
The weekly candle chart (5 years) helps us see the launching consolidation pattern.
The daily candle chart (1 year) shows us the current battle at the breakout line (resistance).
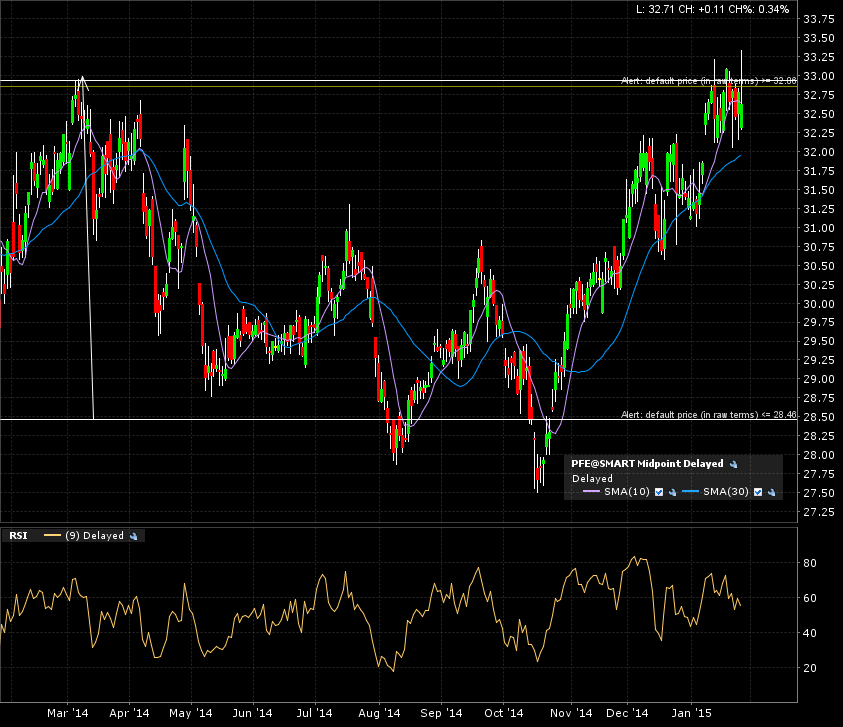
I set some alerts, including the important one at 33. A monthly close above that line will definitely give me a closer look to see if the risk to reward will be worth it!