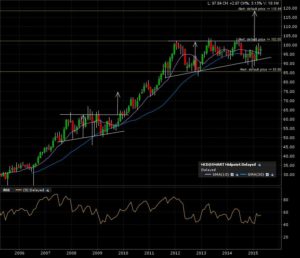
McDonald’s Corp. (MCD:NYSE) is ready to get super sized. Check out the 10 year monthly candle chart. After a breakout in late 2009 and a reached target less than 1 year later, another consolidation/continuation “ascending triangle” classical chart formation is in progress. The breakout line is set at 102.
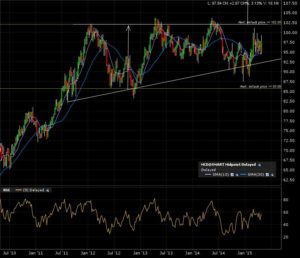
The 5 year monthly candle chart shows some noise below the rising trend line. Check out this previous post on the “noise reduction” properties of the monthly candle.
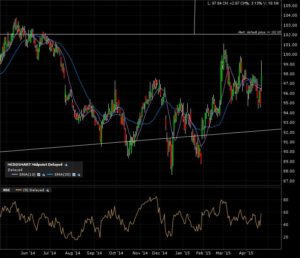
Zoom in on the daily candle 1 year chart. Lot’s of noise here with the price action is in no man’s land.
My alerts are set. A monthly close above 102 would give me an implied measured move added to the breakout line at 118.50.
The bearish scenario would be possible with a trigger of my alert at 86.


