I decided to take a look and see what’s up with AAPL. Let’s start with the reliable monthly candle 10 year chart.
What sticks out is that HUGE ascending channel. Secondly, there seems to be some consolidation/resistance at the upper channel line.
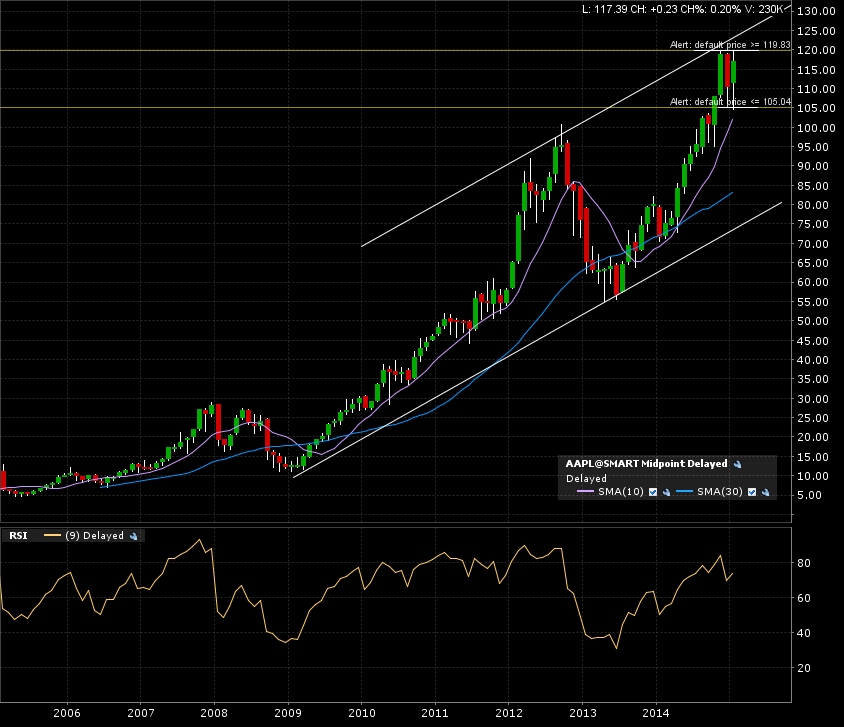
Zooming in on the 5 year weekly candle chart, same story. I set some alerts at what seems to be the closest important resistance and support levels.

We can see on the daily candle 1 year chart the recent gap.
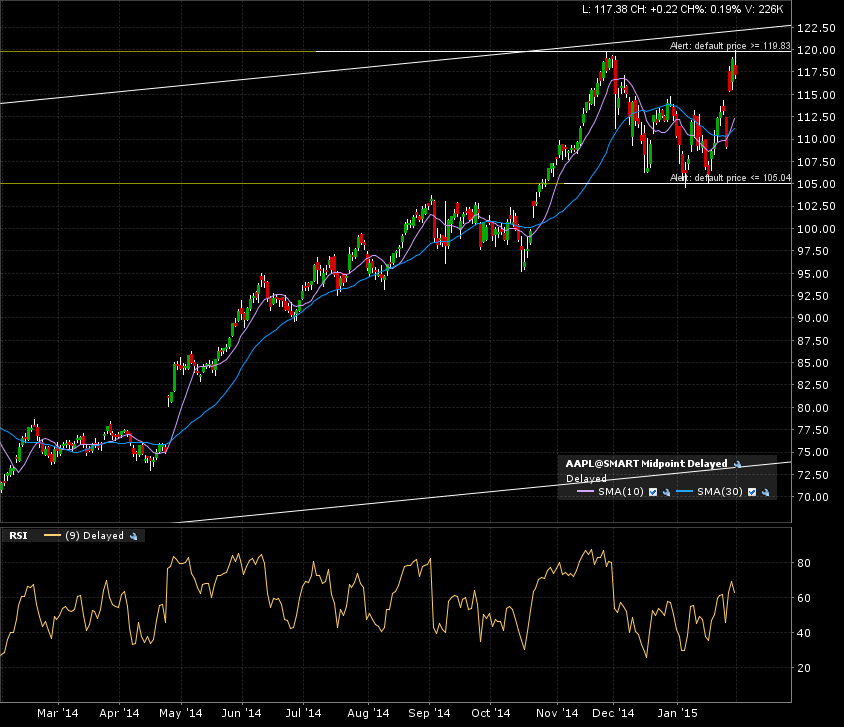
I’ll come back to this ticker when one of the alerts is triggered. Looks like the ascending channel might morph into something else IF there can be a convincing (monthly candle) close above the 120 mark. The target would be a measured move to the 135 mark . Math: top of rectangle, 120 minus bottom of 105=15 added to the breakout line (top) of 120. The apple hasn’t fallen yet, and might still grow some more!