Here is one for my friends in France. Fell on this +5 year chart with monthly candles for Gemalto NV (GTO.PA).
That is one top formation testing it’s breakdown line (support).
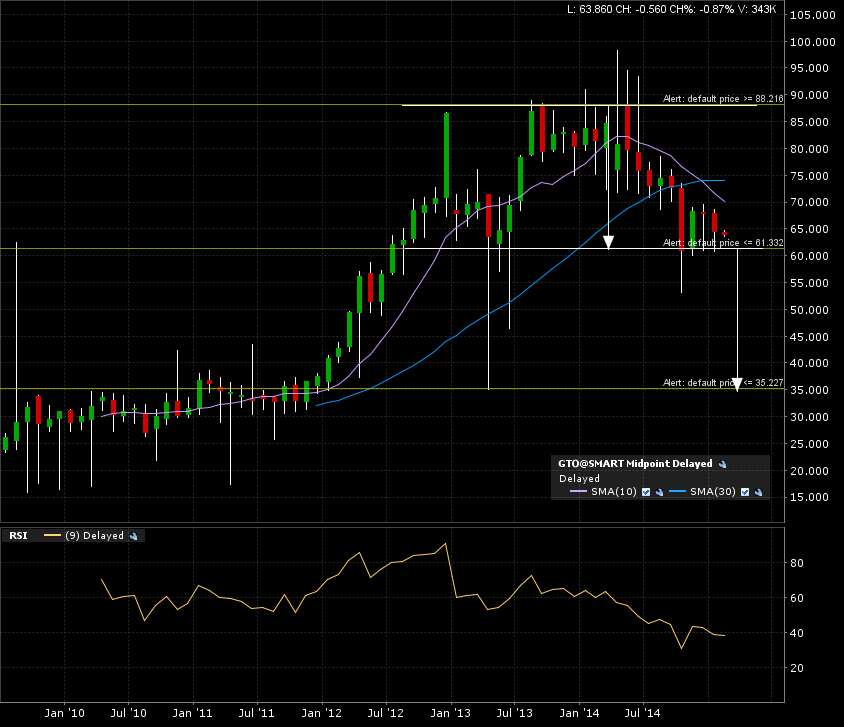
The weekly candle chart, we can see some noise showing some breaking down action. I guess a question of time… maybe.

And now the final zoom with the daily candle chart (1 year). There you can see the consolidation rectangle in progress. This will be the launching pad of the next direction when resolved (up or down).
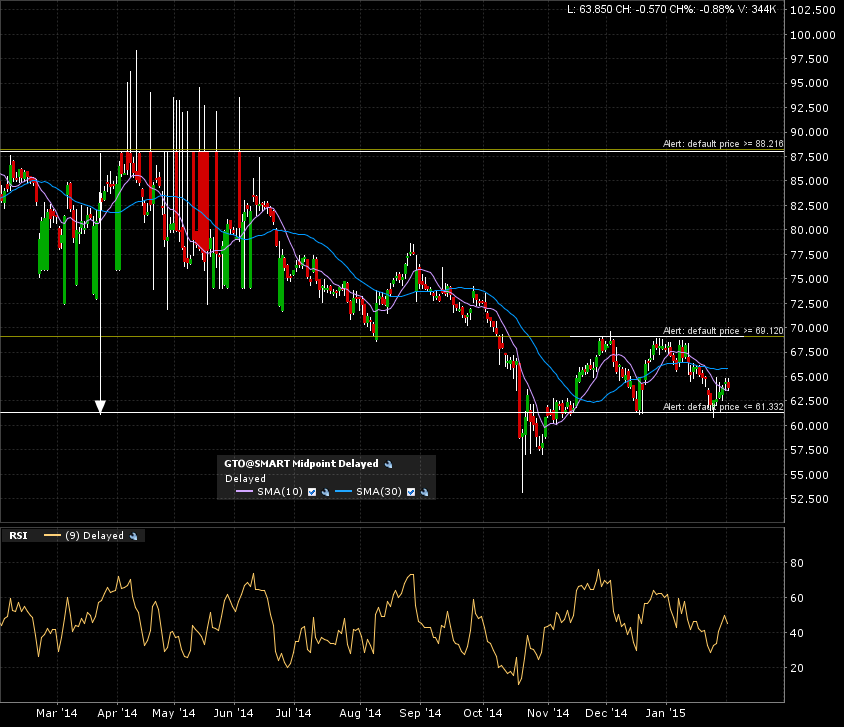
The implied measured move is the arrow (top to bottom of formation) added to the breakdown line. Just set your alerts and wait for the monthly close below it!