This stock has been rapidly getting attention for the past week, so I decided to see if it passes my test to get the A+ setup grade!
Here we go. The is a 7 year base on the monthly candle chart and that makes for a huge cup and handle classical chart pattern.
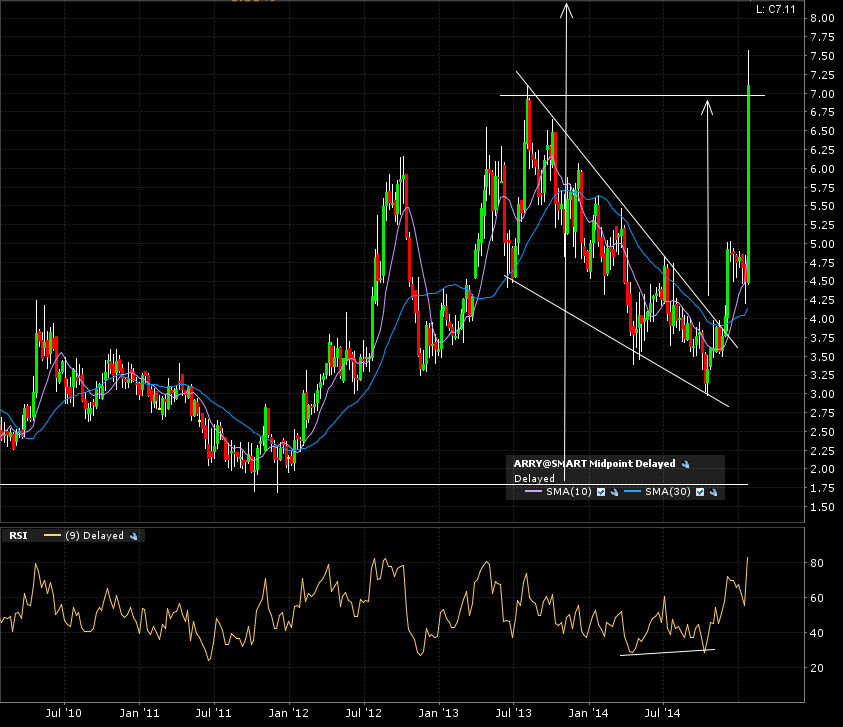
The implied measured move for the base would be the previous 10 year high of 14.50 (as shown with the longest arrow). I established my breakout line with the previous resistance around the 8.20 mark. I want to see it break that level before entering.

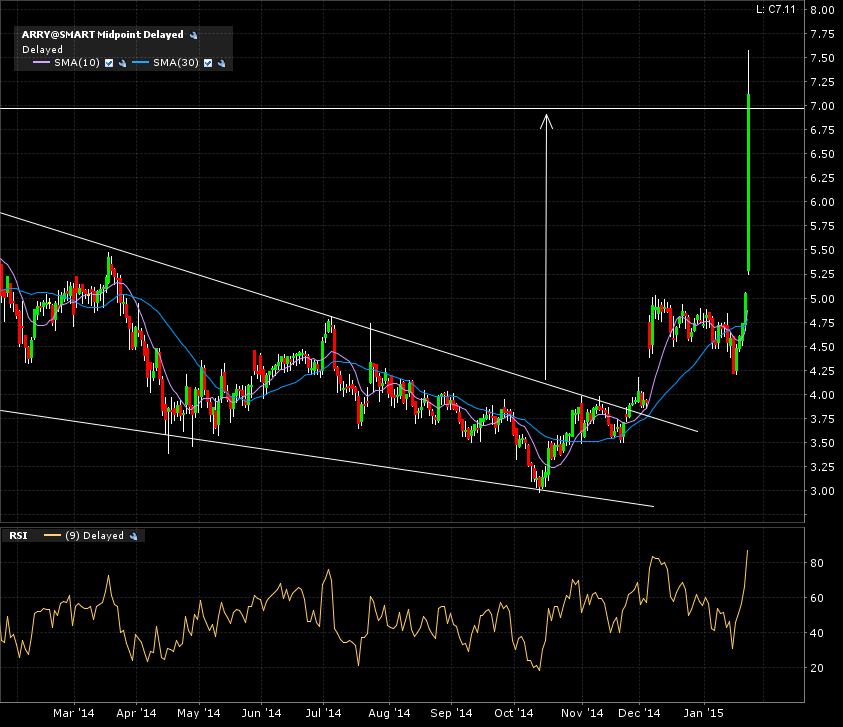
Lets look on the weekly candle chart what was brewing. A nice year and a half falling wedge reversal classical chart pattern was broken out of in late 2014. It’s implied measured move has been hit last week (as shown with the smaller arrow).
A zoom in on the 1 year daily candle chart shows us a first regular gap and a second breakaway gap.
Right now, I have no point of entry. My alert is set at 8.20 and I’ll reanalyse after a close above that mark. I don’t want to get whipsawed at that potential resistance line. This is still setting up for a bullish run once broken.