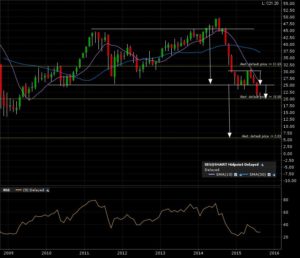
SPDR S&P Oil & Gas Equipment & Services (XES:ARCA) has broken down from a HUGE 6 year top formation. Target is 5. There is a WALL at the 2009 lows around 15. Check this post on why to consider this important concept. Turbulence might occur here via support. Check out the monthly candle chart.
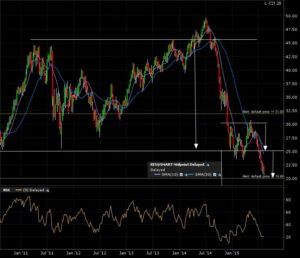
Here is the 5 year weekly chart. You can observe the smaller consolidation pattern which had coinciding breakdown line with the HUGE top formation. I believe this adds value to the ensuing breakdown via added probability of reaching the possible target. A+ materiel.
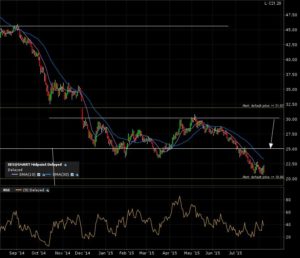
A final zoom in on the 1 yea daily candle chart. Breakdown and target reached of the “take off” consolidation pattern.
Here you go, enjoy!


