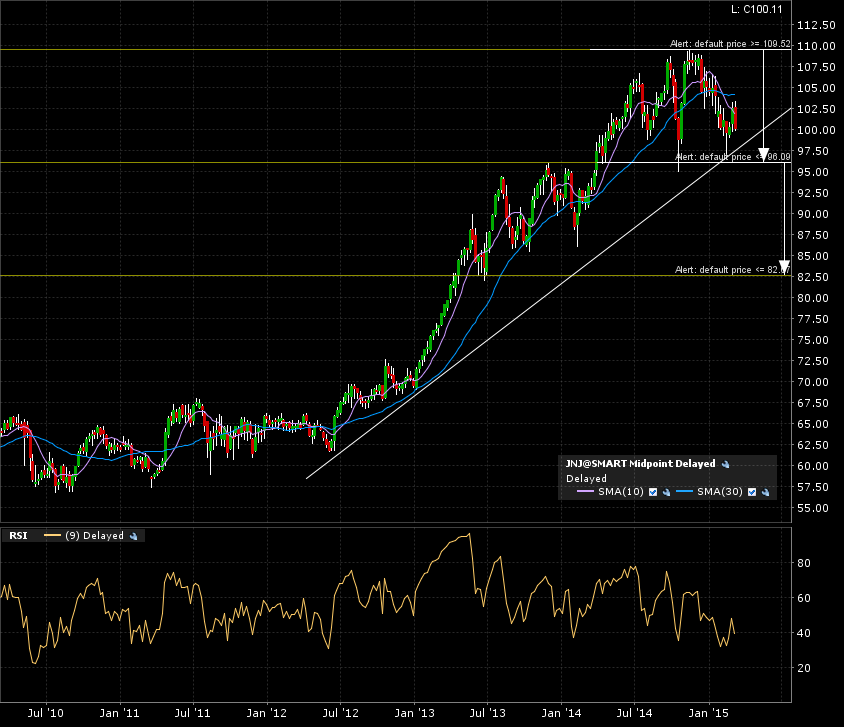
JNJ’s own baby oil might make this stock slip back! Check out the monthly candle chart (+8 years). A 1 year top formation is brushing against the ascending trend line. The arrows indicated the implied measured move added to the breakdown line.

Here is the weekly candle 5 year chart. We can see the tests of the horizontal support line at 96.
Zooming in on the daily candle 1 year chart. Price action closing in on another test of the breakdown line.
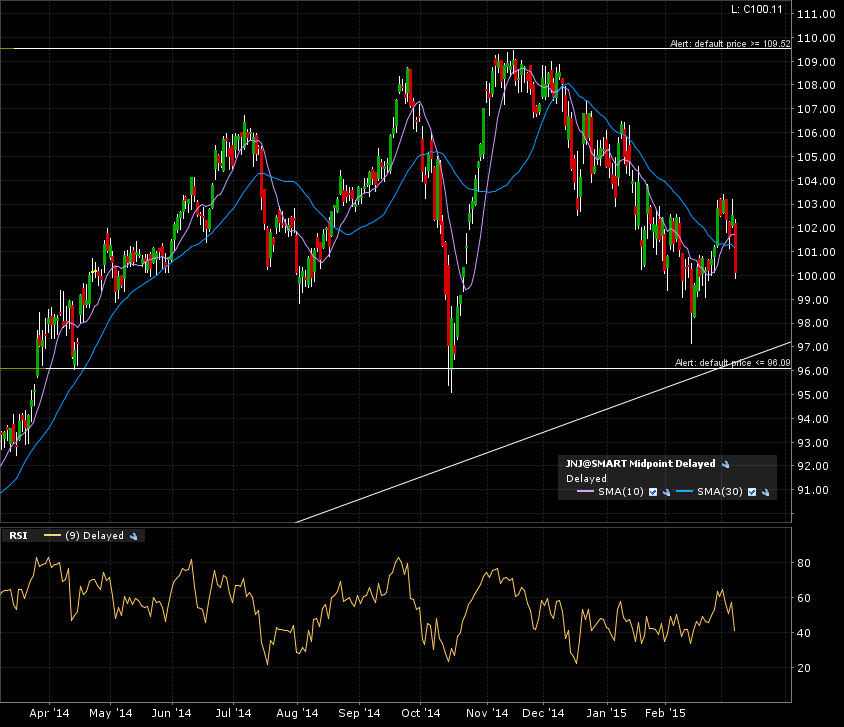
My alert is set. I’ll wait for it to get triggered and see how much the baby oil made this slip!
Remember a monthly candle close below the breakdown line is necessary o confirm the breakdown and it’s implied target at 82.50.