Exxon (XOM:NYSE) has morphed from a bullish scenario to a bearish one. A failed move towards target even after a confirmed breakout is always possible. That is why I have risk and money management protocols. Check out my “How To” now!
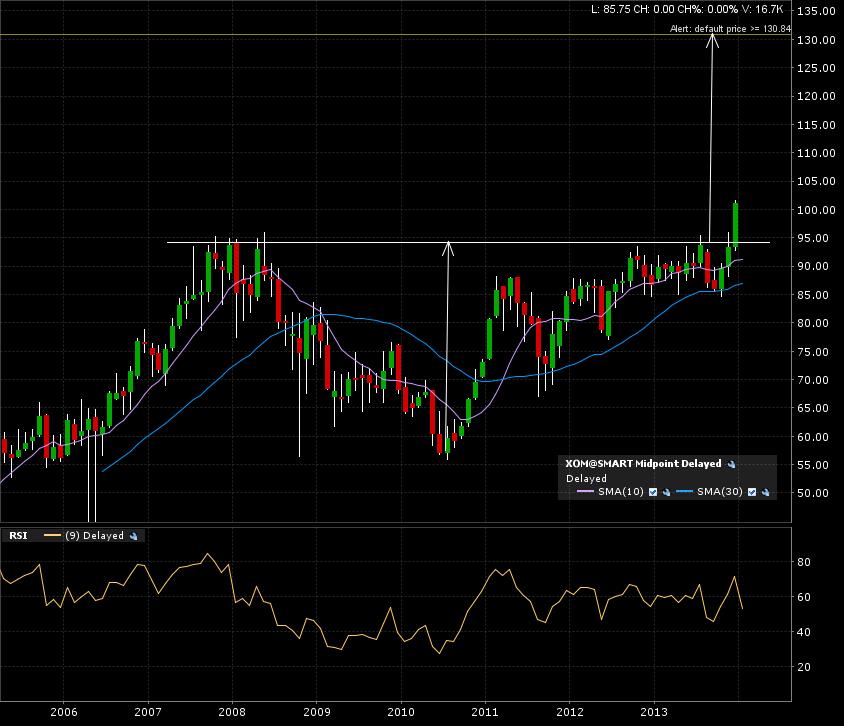
Here is the monthly candle graph with the bullish original classical chart pattern rewind late 2013. December 2013, a breakout candle confirms the break above the 95 breakout line (resistance) to yield an implied measured move target at 130. Oh, this is going to be sweet, easy $$$.
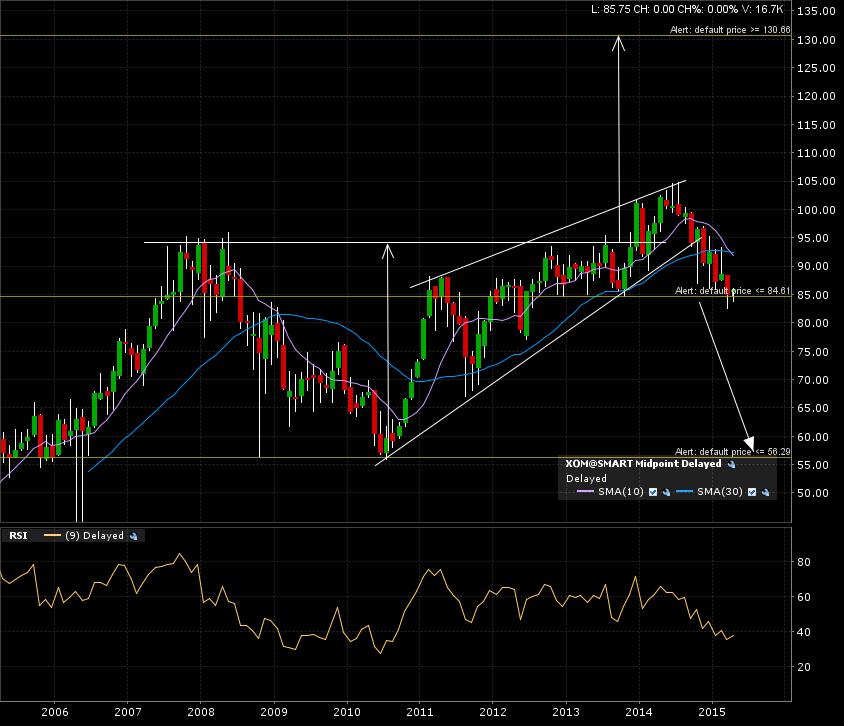
Hold on! Fast forward +1 year to today. What happened? The breakout obviously failed. A fresh look and now I see a classical chart pattern known as a “rising wedge”. The morphing has occurred. I have to forget what happened or didn’t happen +1 year ago. This is now reality and my next decisions will be based on this new reality.
A break below 85 breakdown line (support) will yield an implied measured back to the base of the “rising wedge” formation or 55. This also coincides with some historical support at that 55 level.
There you have it. NOBODY knows the future. Thank goodness my risk and money management protocols didn’t let me follow the “got a hunch, bet a bunch” saying. A play like this would of made me lose only 0.5% of my NAV (Net asset Value). Now, with my capital still intact, I can play the possible breakdown about to occur. Live to fight another day!