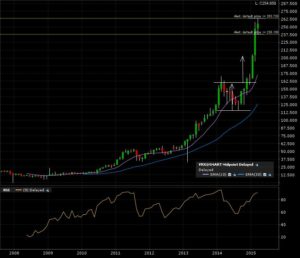
Enter Valent Pharma (VRX:TSE). After a 1 year consolidation pattern, Valent has exploded in outer space! The breakout line was at 160 and the target was reached 2 months later. Check it out on the 8 year monthly candle chart.
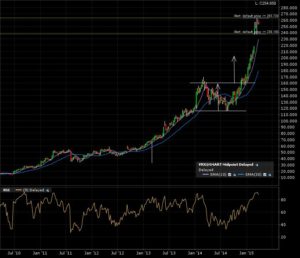
The 5 year weekly candle chart is giving no signs for entry. This needs to morph into a classical chart pattern, then I’ll have my entry and exit points.
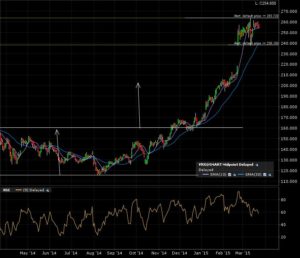
The zoom in on the daily candle 1 year chart shows some consolidation beginning after that gap up.
I set some alerts close to nearby support and resistance levels. Once triggered, I’ll come back to this chart and see how the patterns have evolved.
In the mean time, I’m going continue scouting other charts out there in the universe.


