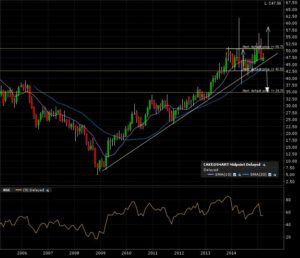
Check out cake and the two possible scenarios drawing out on the monthly candle 10 year chart. A monthly close above 51 gives a target of 60. A monthly close below 42 gives a target of 33.
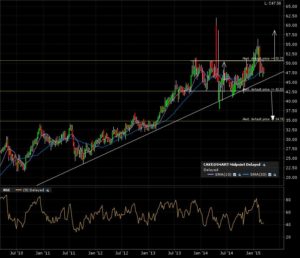
Some noise on the weekly candle 5 year chart. All avoided with the noise reduction power of the monthly candle close.
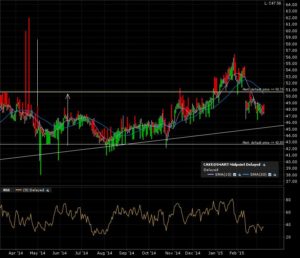
The zoom on the daily candle 1 year chart shows the price action closing in on the ascending trend line.
No cake for me yet, but my alerts are set for either bullish continuation OR breakdown back to the previous breakout levels.


