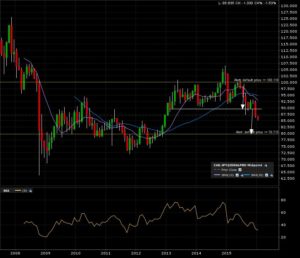
New year getting really serious for the cadjpy forex pair. Here is the 10 year monthly candle chart. Confirmed breakdown in progress with the decembre candle close below the 90 level. Target is now 80 (which also coincides with the previous late 2012 bullish breakout.
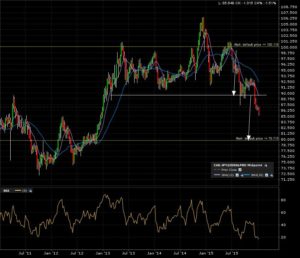
The 5 year weekly candle chart shows the small continuation pattern breakdown below 86.25.
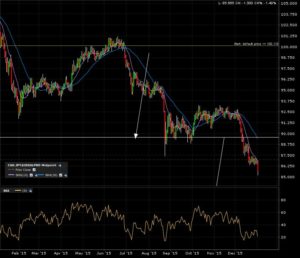
And here is my classic final zoom in on the 1 year daily candle chart. Price action is trending as the weekly and monthly charts. A+ material!
Time to ride this one down the slope all the way to target for some “Serious” gains!


