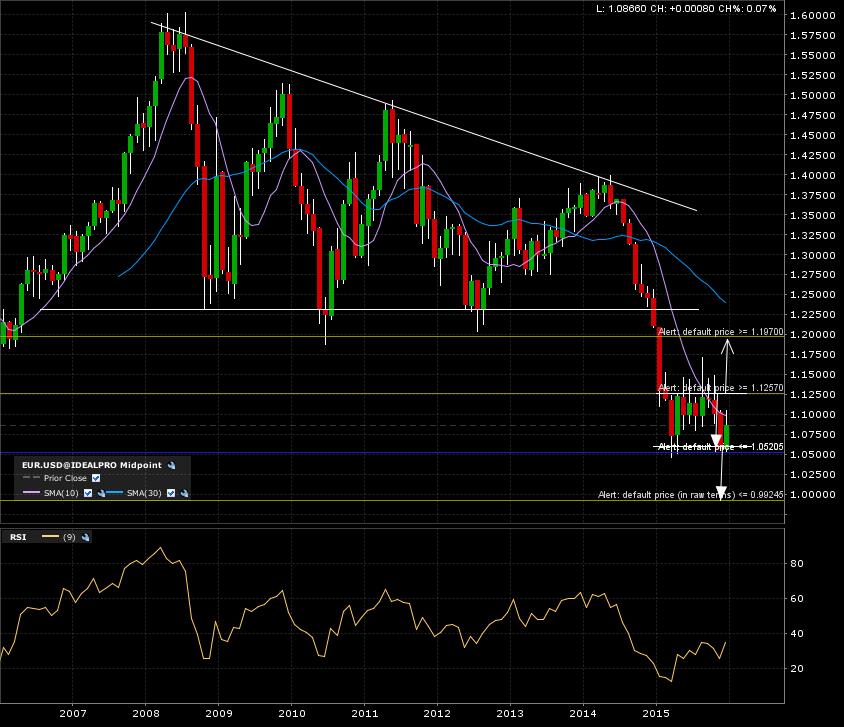
Let’s take a look at eurusd forex pair. Here is the 10 year monthly candle chart. Nice consolidation pattern (+10 months) just bouncing off the support. Arrows indicate the next mesured move in case of a monthly candle close across the break line.
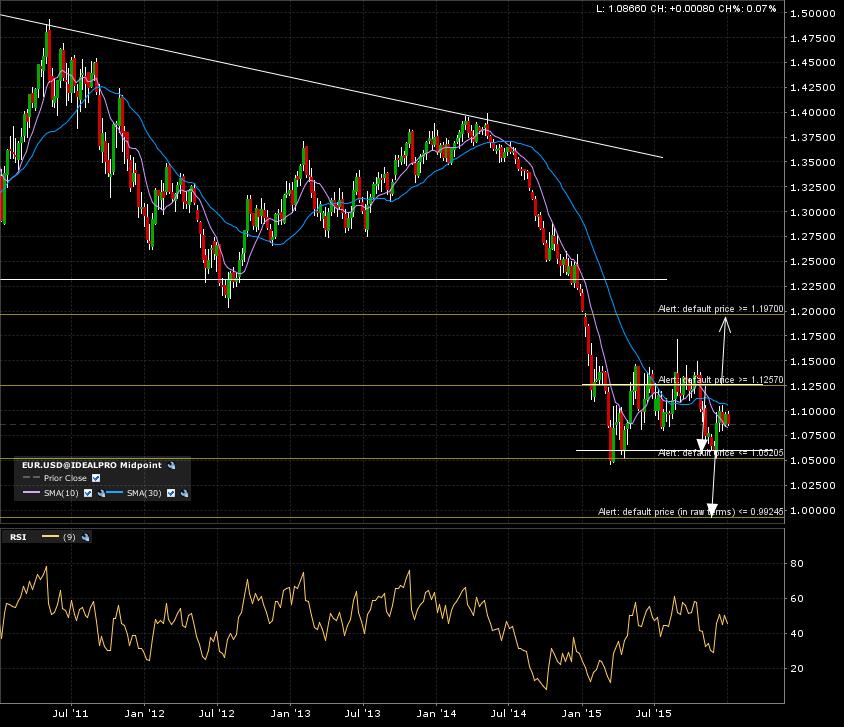
The 5 year weekly candle chart show more of the same. Price action right now smack between the breakout level at 1.125 and breakdown level at 1.05.
A final zoom in on the 1 year daily candle chart. No man’s land.
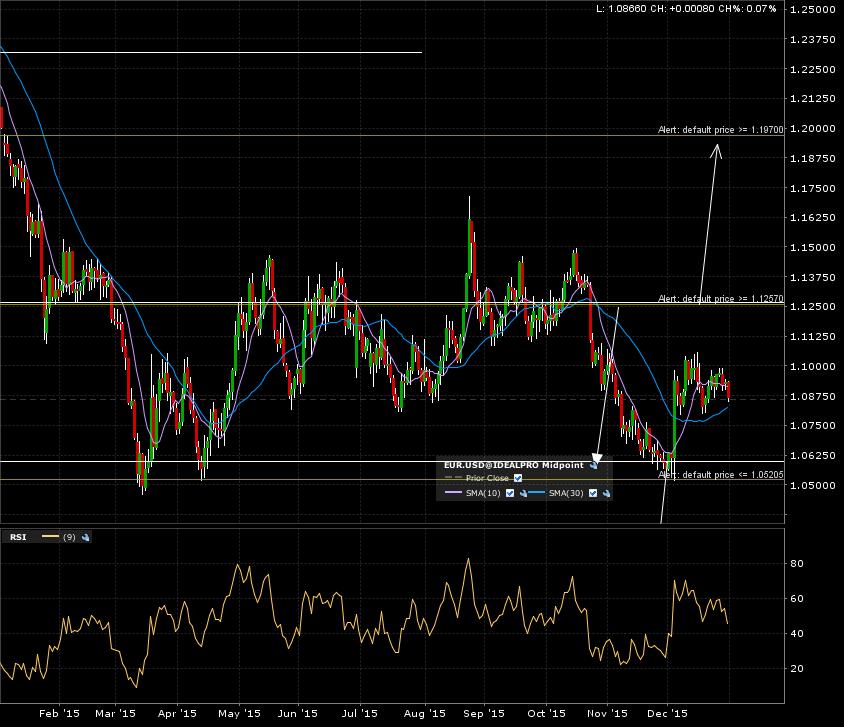
This pair is starting off the new year needing some time to choose it’s next tagert. Bullish breakout would bring this pair to 1.197. Bearish breakdown would give a target back at parity. All is “ordinary” for now… Patience required.