A friend of mine asked me to relook at Bombardier (BBD:TSE) after getting news of the Delta deal.
I wrote a post back in early 2015, you can check it out here. Time has passed, check out my concept about chart morphing here.
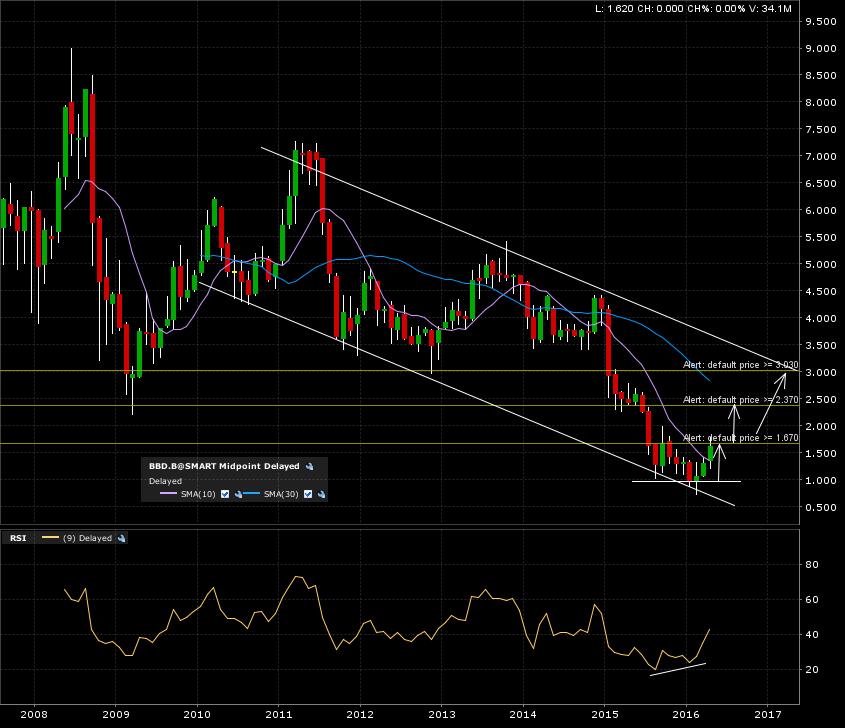
Let’s look at the monthly candle chart right now. Notice the BIG +6 year descending channel. Some bullish divergence with the RSI, this could be a bottom.
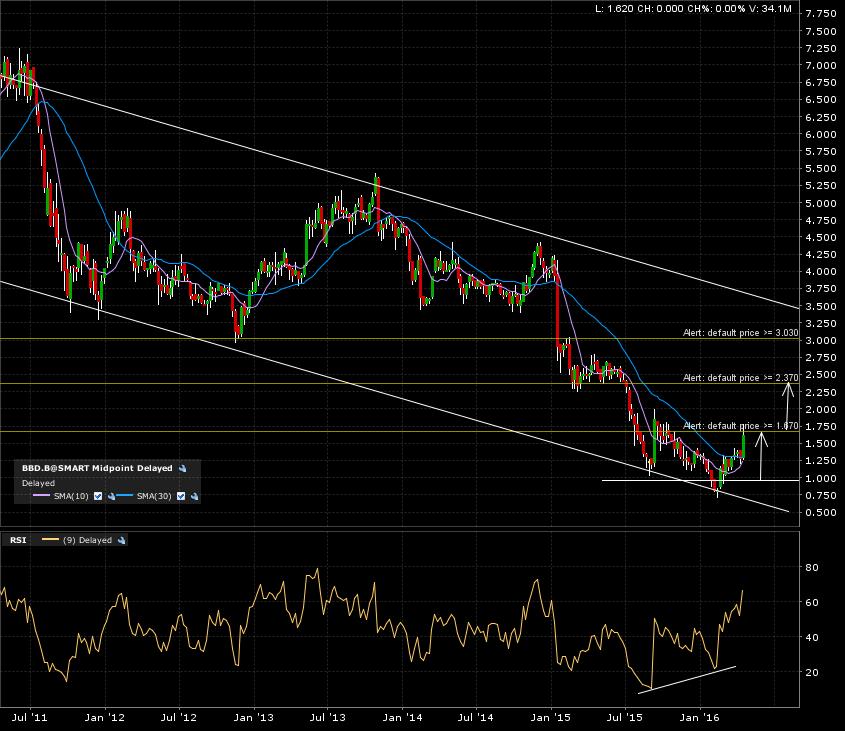
Here is the weekly candle chart. More of the same.
And a final zoom in on the 1 year daily candle chart. Nice breakout of the bottom formation and current test of support turned resistance zone (also know as a “WALL”. Check my concept here.) at 1.80,.

I’m looking for a monthly candle close above 1.80 to give me a first target at 2.40. The furthest target is a test of the upper boundary of the descending channel at 3.00. So will Bombardier fly higher? Time will tell! Get some tips on patience here.