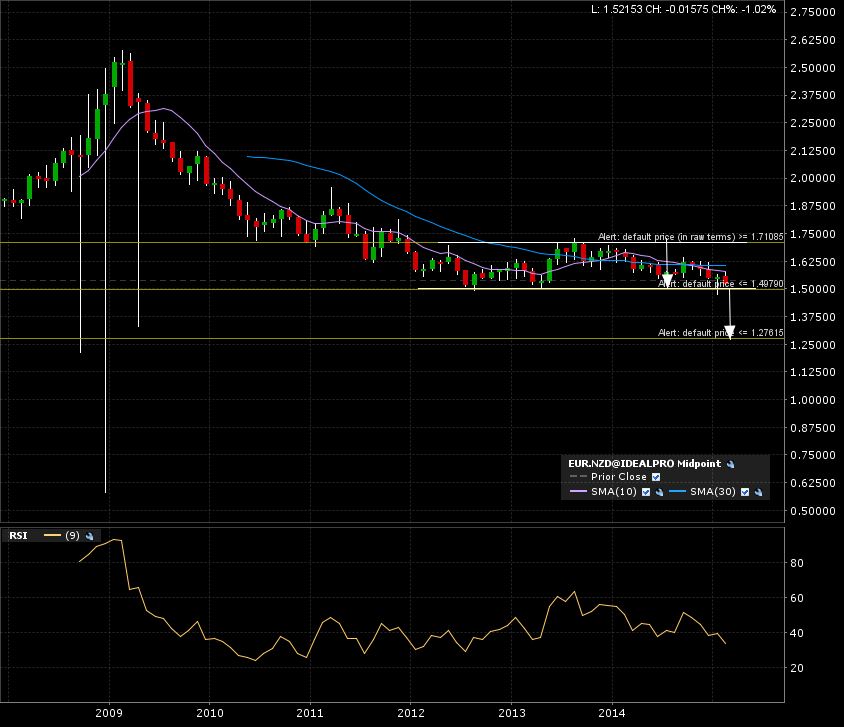
There is a tight +3 year rectangle (continuation) classical chart pattern in the works for eurnzd. The price action is approaching the lower boundary at 1.50. The monthly candle chart (7 years) show the implied measured move in case of a breakdown. There isn’t much support under than level, watch out below!
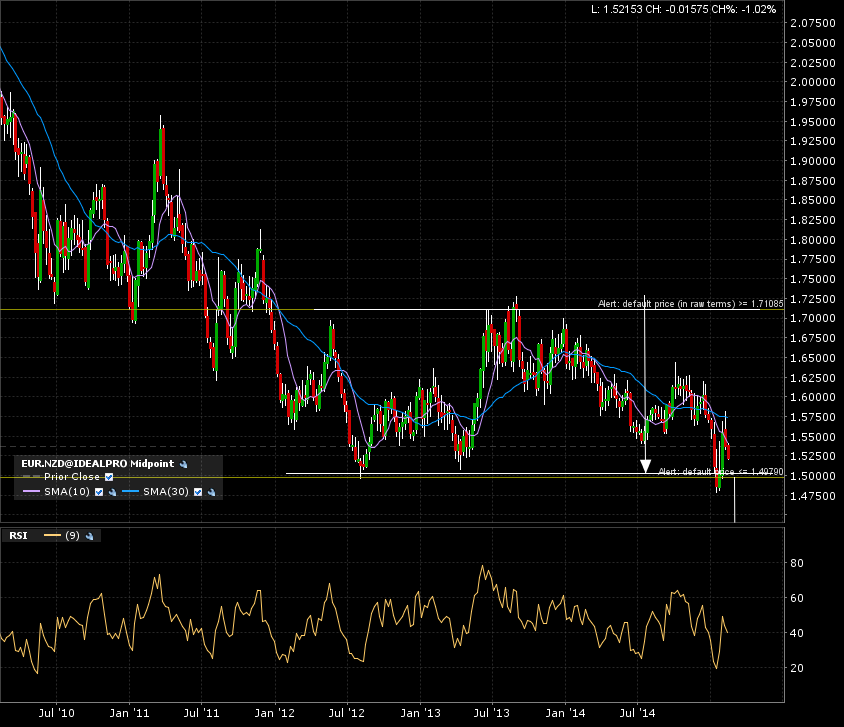
The weekly candle 5 year chart show the action closing in on that support. Notice the previous failed breakdown. Price action noise like this can sometimes be avoided using a monthly candle close to confirm the breakdown. Check out this previous post on how to reduce noise.
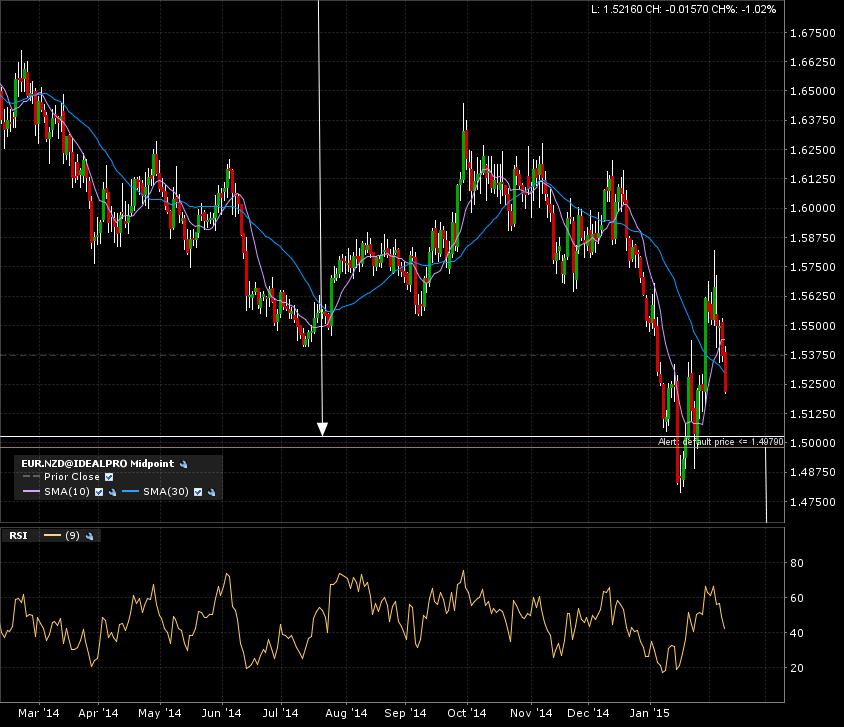
The action on the daily candle (1 year) chart says there is maybe a few days of action before we get back down to the 1.50 support level.
I set my alerts at 1.50. Will see if I can get a monthly candle close below it. A tight +3 year consolidation rectangle might yield a further target than the implied measured move (width of the rectangle). This currently an A+ setup.