Is Micron Technology about to go micro on us? A +7 months top formation in progress. I have two possible scenarios for mu, but right now we are closest to the bearish one. Here is the monthly candle +5 year chart. The arrows pointing to the implied measured moves, IF a monthly candle close can happen above the resistance line or below the support line.
The weekly candle chart also shows some bullish hope for a potential rush to test the breakout resistance line because of hidden bullish divergence with the RSI.

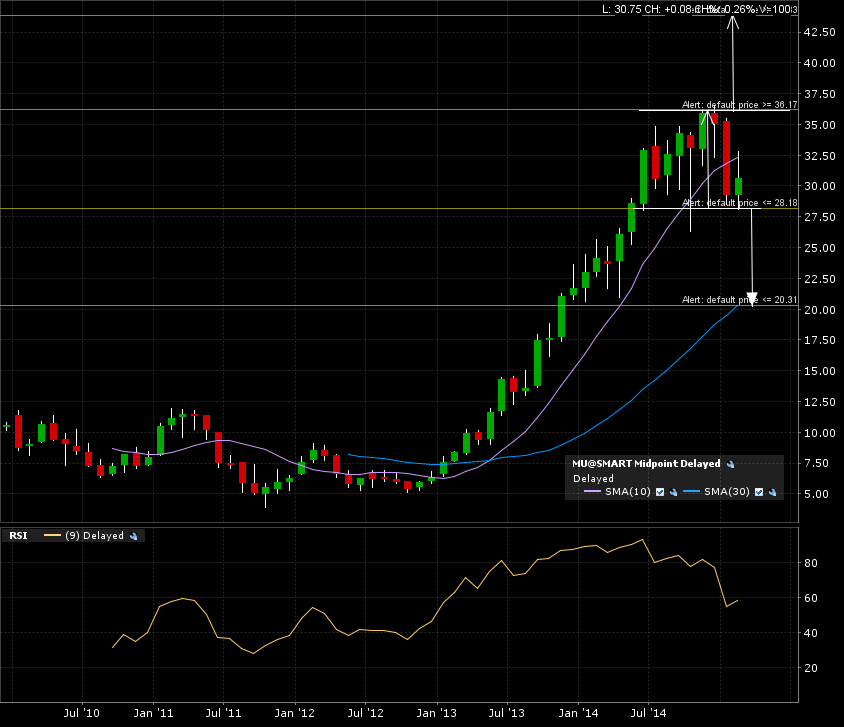
Here is the 1 year daily candle chart. The price action is in no man’s land.

I set my alerts at 28 (for the bearish scenario with an eventual 20 target) and 36 (for the bullish scenario with a 44 target). Once triggered, I’ll get back to this chart and see if it meets my risk management protocols. See here how I do it with my “How To”.