After analysing the possible setups with Bombardier, a friend asked me to check out other aircraft manufacturers.
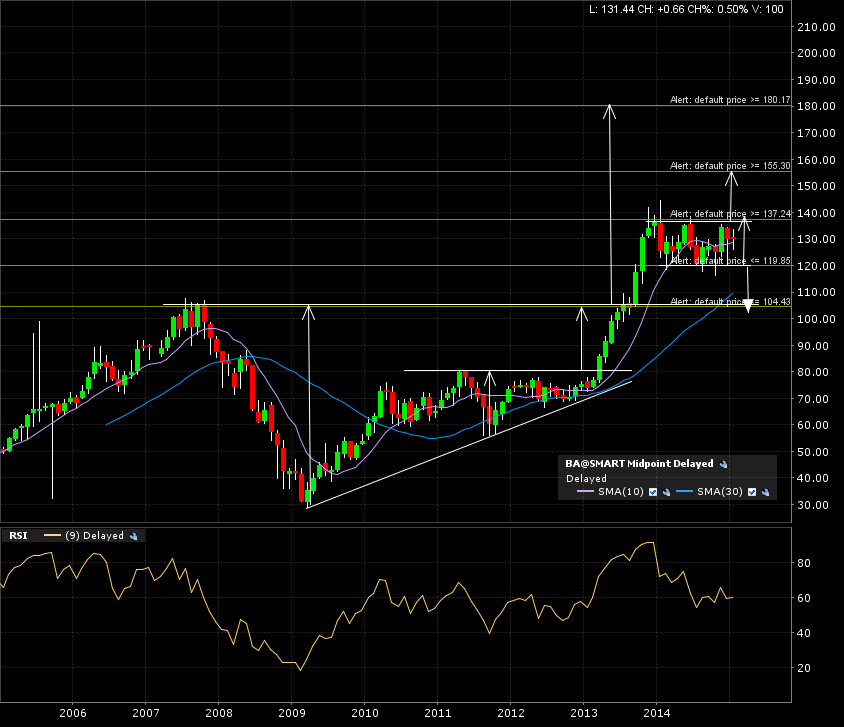
Enter Boeing Airlines. The first few lines and arrows on the monthly candle chart (10 years) show us two targets from a long (3 year) and longer base (7 year) formation. The 3 year classical chart ascending triangle formation has reached it’s target. The 7 year base is currently in progress towards it’s target.
The weekly candle chart (5 years) shows us a consolidation pattern with two possible targets.
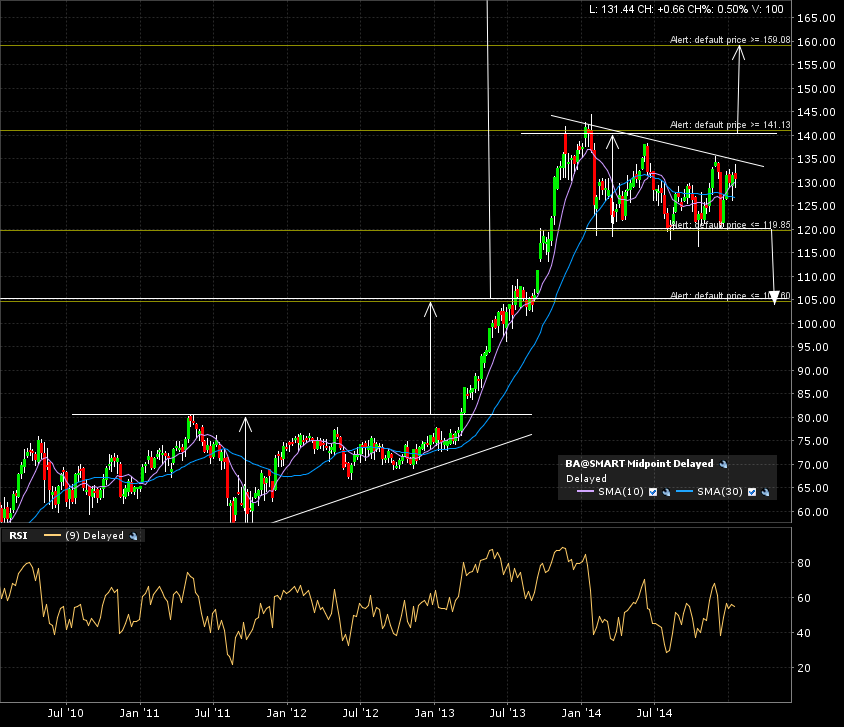
Zoom in on the daily candle chart (1 year) and we can see the diagonal upper resistance line is close to being tested.
I’m waiting for a breakout above the next important horizontal resistance line before taking a position (that is why the bullish target arrow is above the horizontal line, not the diagonal one). I believe horizontal support or resistance breakouts have a higher probability of reaching it’s target than a diagonal breakout’s implied target.

So there you go. Lots of lines and arrows, to show there are always two sides to a trade. You have to accept both directions as possibilities. Either which way, when my alerts are triggered, I’ll come back to this chart and see if the ri:re gives my risk management protocols an A+ setup.