6 year and on going ascending channel for United Technologies Corp. Will it continue?
A 1 year range is testing an eventual bullish breakout. Here is the monthly candle chart (10 years):
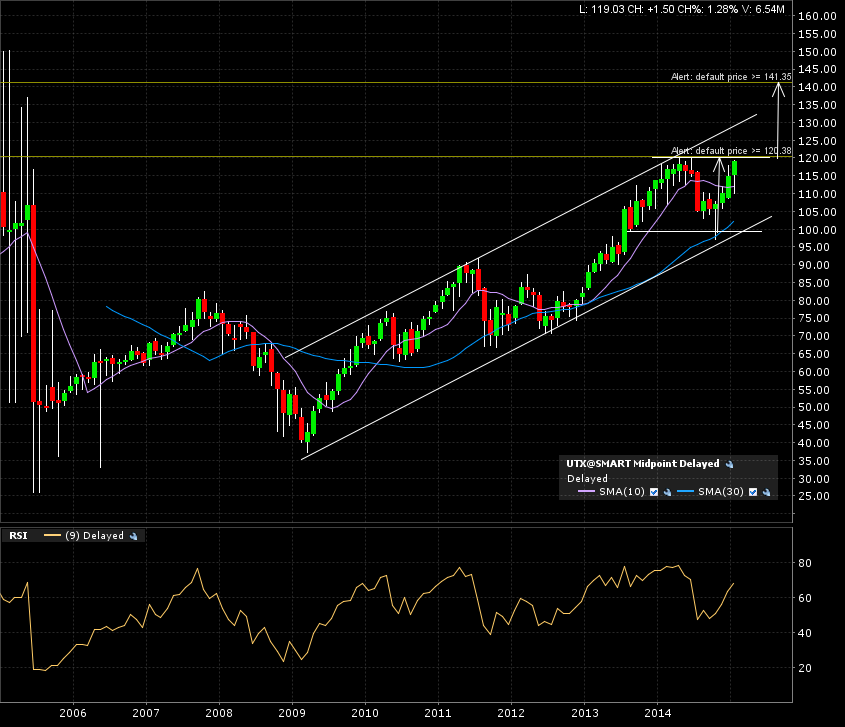
A break and close above my alert at the 120 mark will be my first step before taking a position.
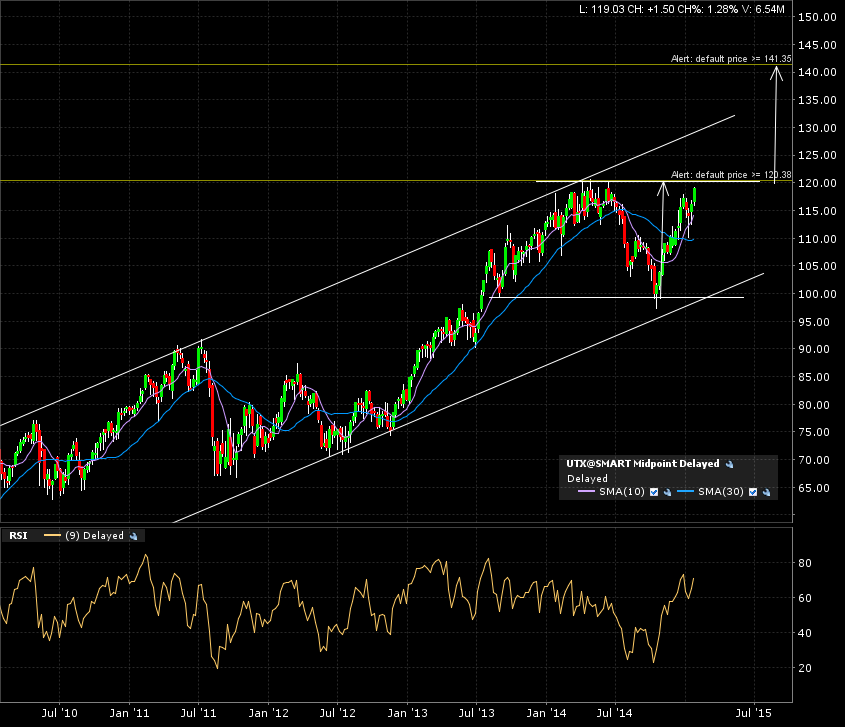
A close up on the weekly candle chart (5 years) shows the bounce off the lower channel boundary and very soon test of that horizontal resistance line.
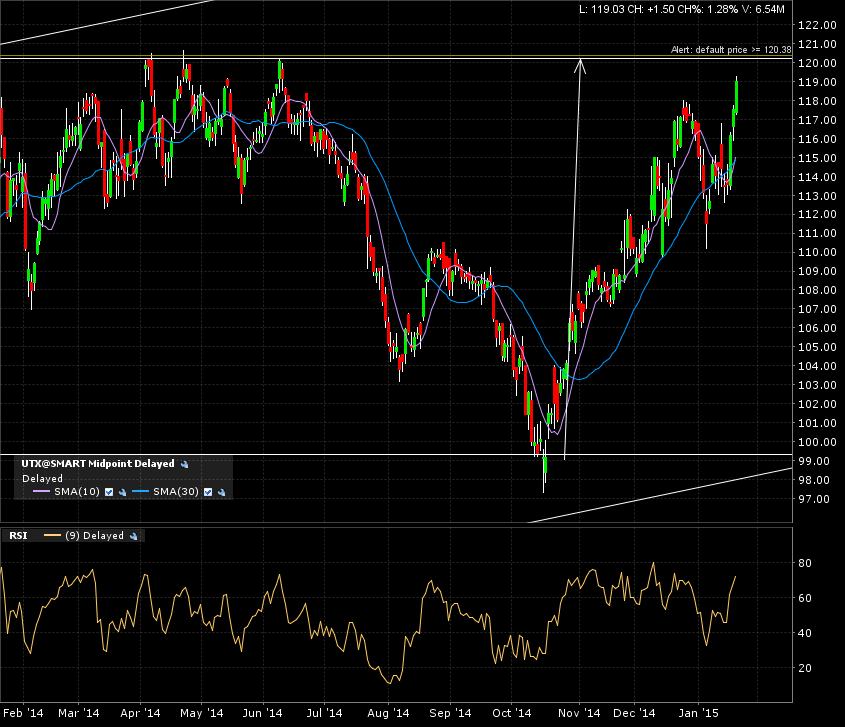
The daily candle chart (1 year) show the multiple times the 120 line was tested.
Keep a close eye on this one for a breakout and possible move to the upper channel boundary.