Trenches are being drawn for SPDR S&P Retail (XRT:NSYE). The price action is morphing and tracing out a new possible top pattern. Check out the monthly candle chart. I have the breakdown line at 80. monthly close below that and I have an implied measured move added to that breakdown line giving a 60 target. This case is also supported by the “bearish divergence” with the rsi. A close above 100 will also invalidate this scenario and possibly imply a bullish one (not covered in this blog entry).

Here is the weekly candle chart. More of the same.

Final zoom on the 1 year daily candle chart. Price action right now in no man’s land.
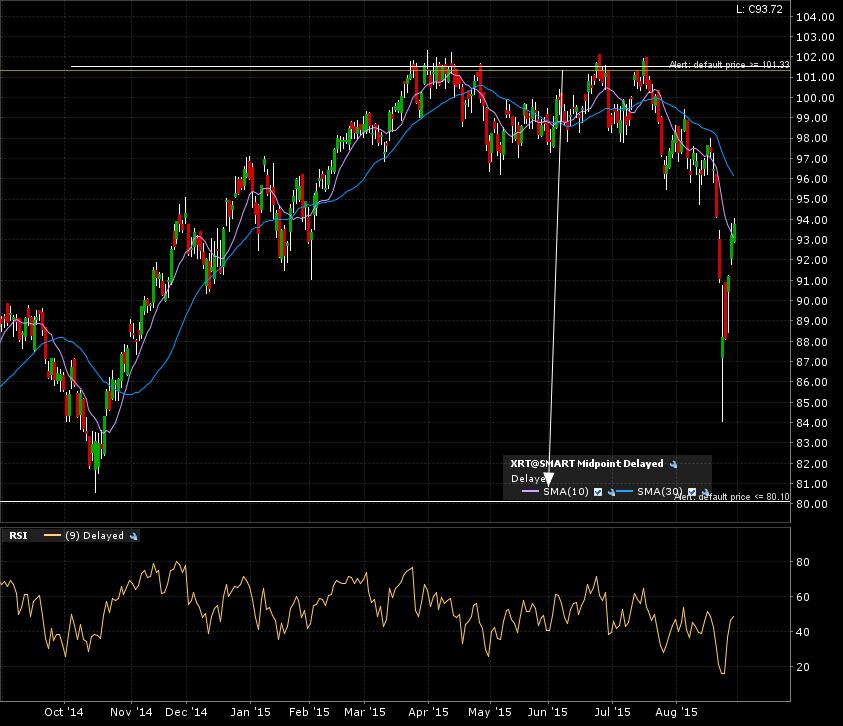
This needs some time to marinate in order to get the next BIG move. Set your alerts. Patience required.