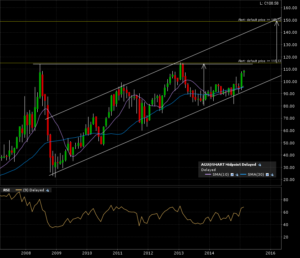
Agu is approaching it’s breakout line of 115 (resistance) on the monthly candle 7 year chart. It’s also in the midst of a HUGE 6 year ascending channel. The implied measured move target would maybe (over time) coincide with the ascending channel’s upper boundary.
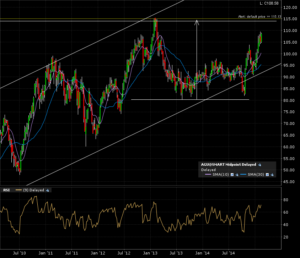
The weekly candle 5 year chart shows the approach to the 115 mark.
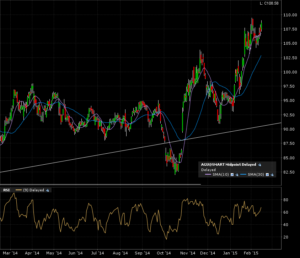
The daily candle 1 year chart shows us some “noise” below the rising trend line. Remember this post on how to avoid whipsaws using the noise reduction power of the monthly candle.
Set your alert at the 115 level and wait. The target would be 150, IF the monthly candle can close above 115.
Check this post on patience if required.


