Electronic Arts Inc. (EA:NASDAQ) is fast approaching some historical 10 year resistance at the 61 level. There was a BIG +5 year base that broke out in early 2014 which reached it’s target about 1 year later. That is about the patience you need when playing these high probability multi-year monthly candle breakouts. A 5-6 year base could take 1 year to reach it’s target. Now go read this previous post on patience.
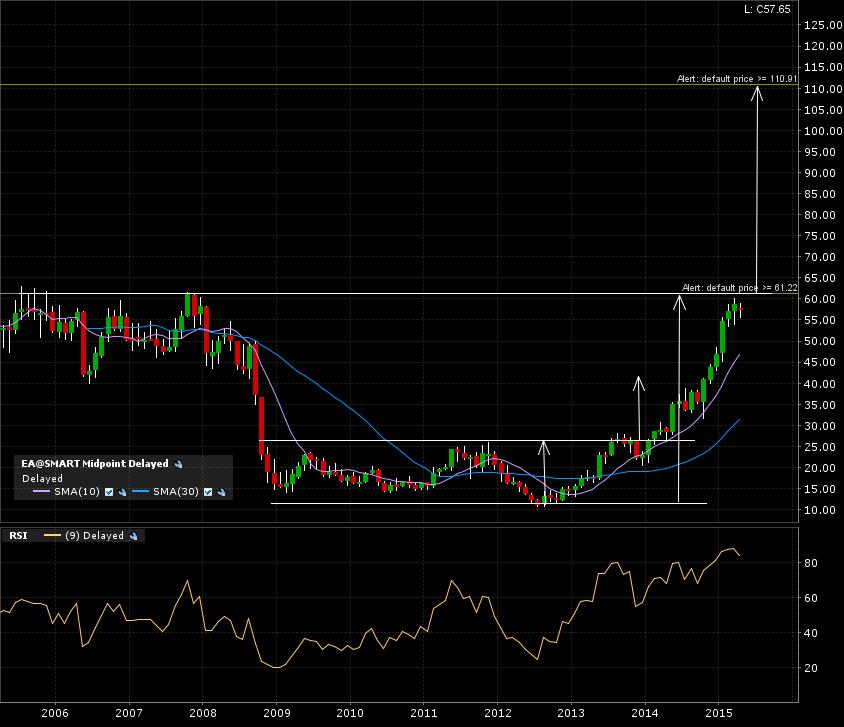
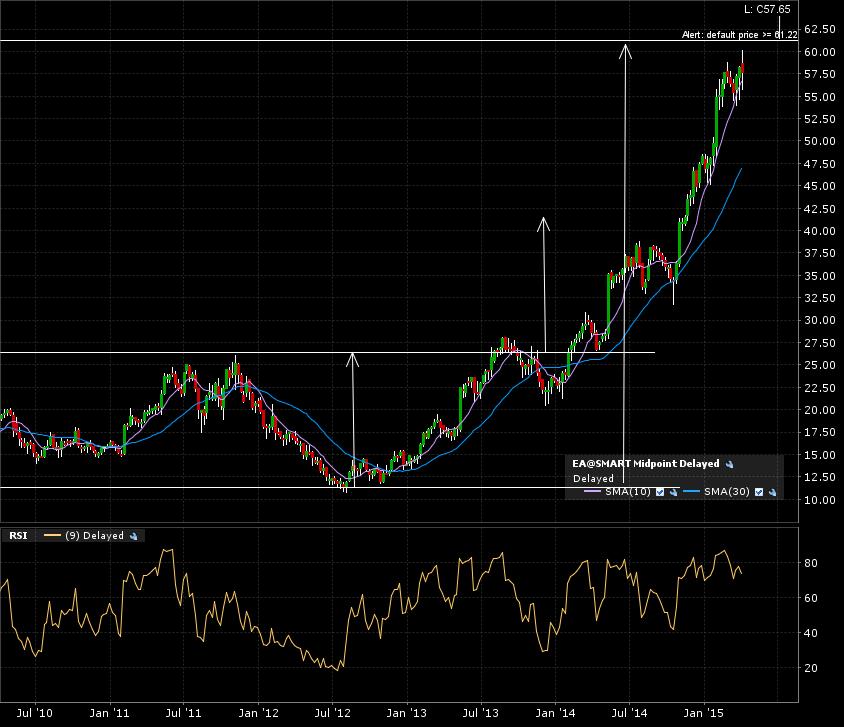
Here is the 5 year weekly candle chart. Closing in on that resistance zone and breakout line.
Zoom in on the 1 year daily candle chart. There is a hint of a consolidation around this area, maybe even a pullback. Bearish divergence with the RSI is visible.
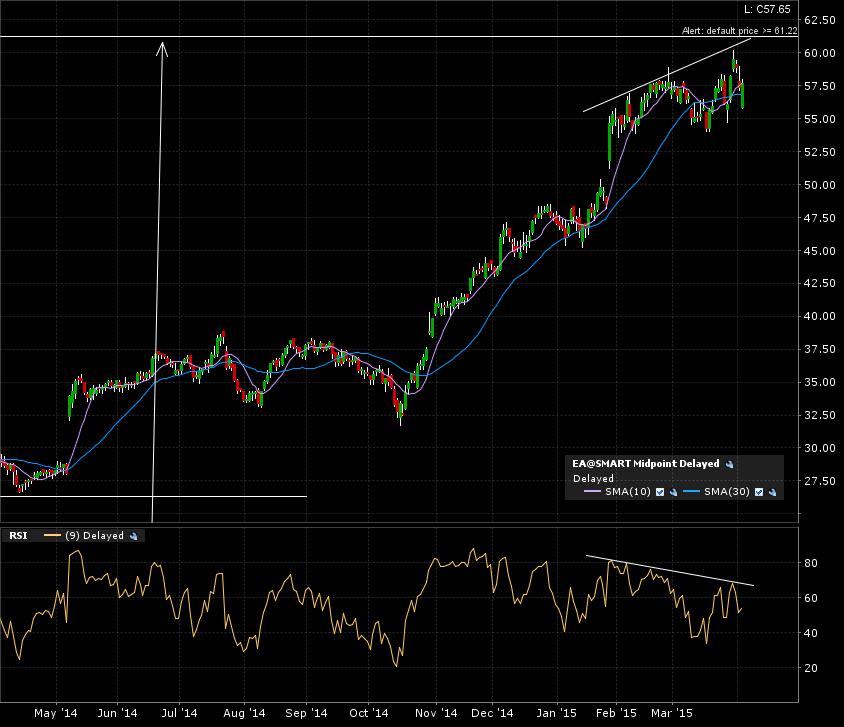
I set my alert at 61 and will come back to this when triggered.
I’m playing monthly candle confirmed breakouts. Less trades per year than if I was trading daily candle charts, but I believe I will get less whipsaws and have increased probabilities of reaching my possible targets based on classical chart patterns.
Go check out my “How To”.