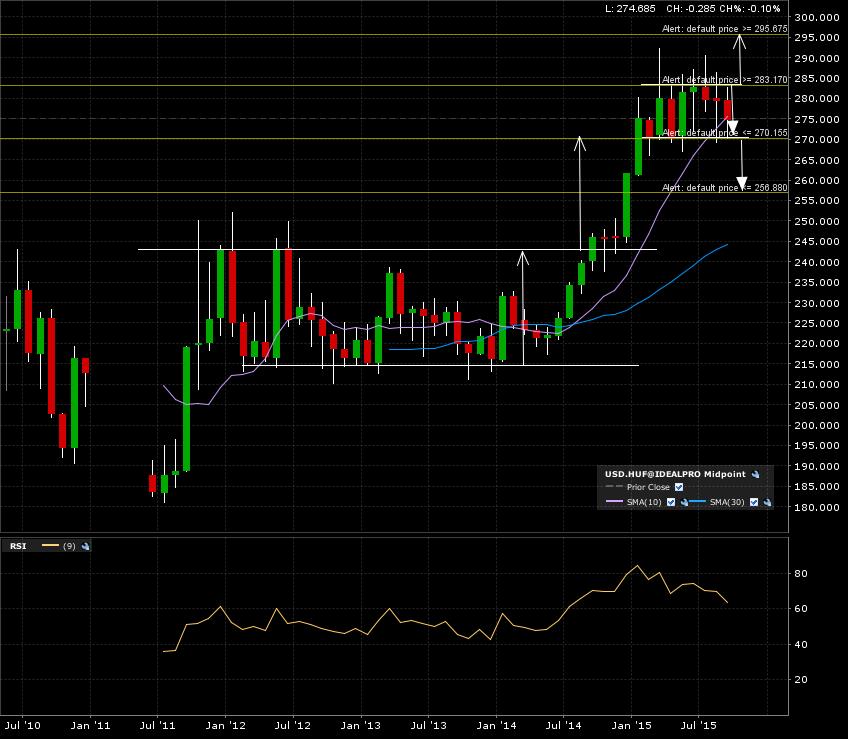
The usdhuf forex pair is consolidating nicely (+7 months) after reaching it’s target from a bullish breakout early this year. The new break lines have been drawn along with their implied measured moves when a monthly candle can close beyond them. Check out the monthly candle chart. A convincing close above 283 would give a bullish target of 296. A close below 270 would give a target at 257.
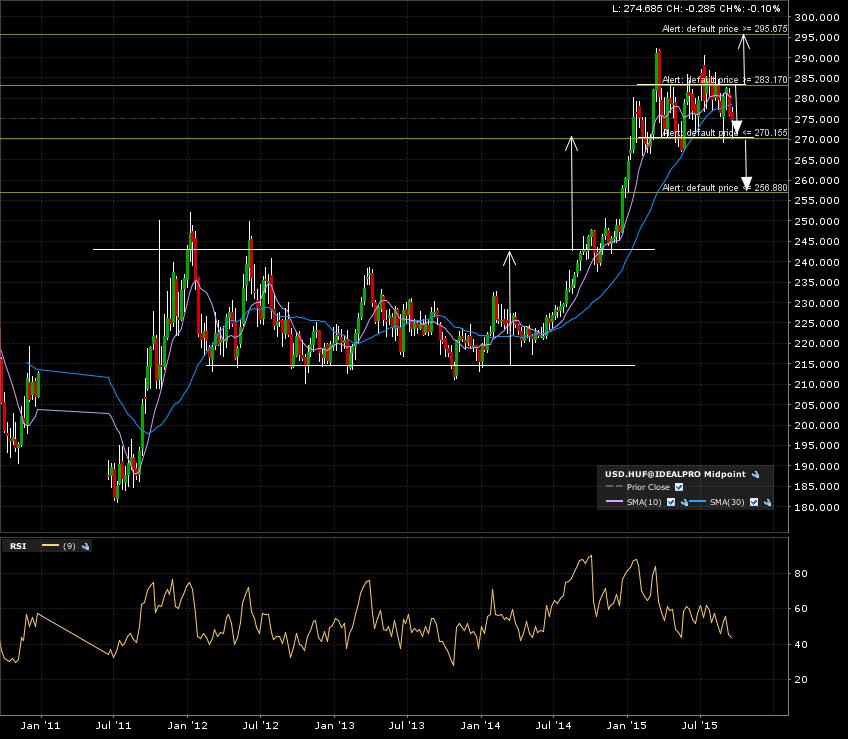
More of the same on the 5 year weekly candle chart.
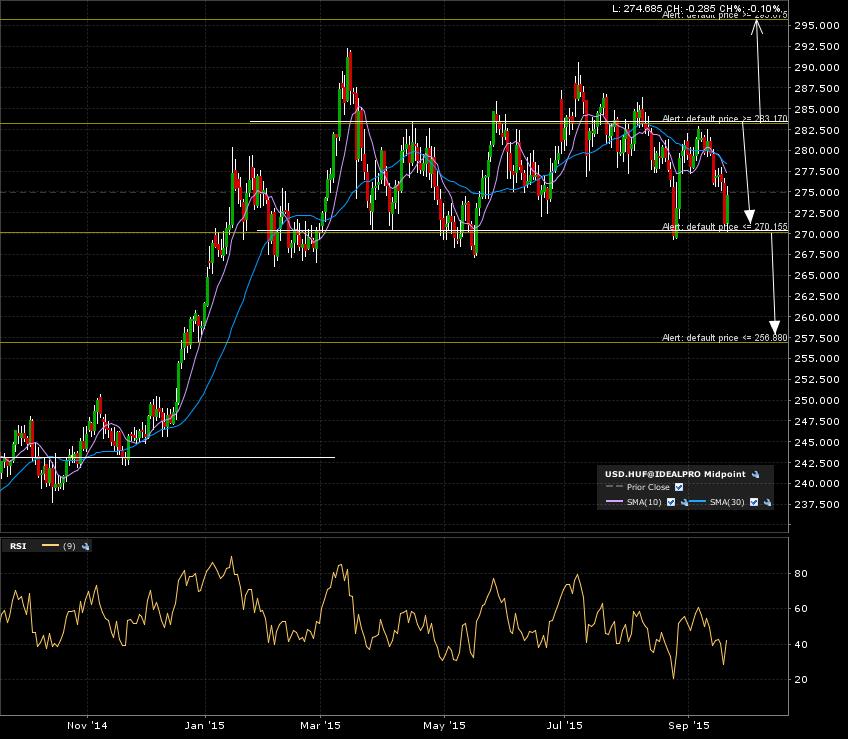
A final zoom in on the 1 year daily candle chart. Current price action just tested the breakdown line.
Set my alerts and will come back when triggered. Let’s see how hungry the Forint is! For more insight on my trading protocols, check my “How To” here.