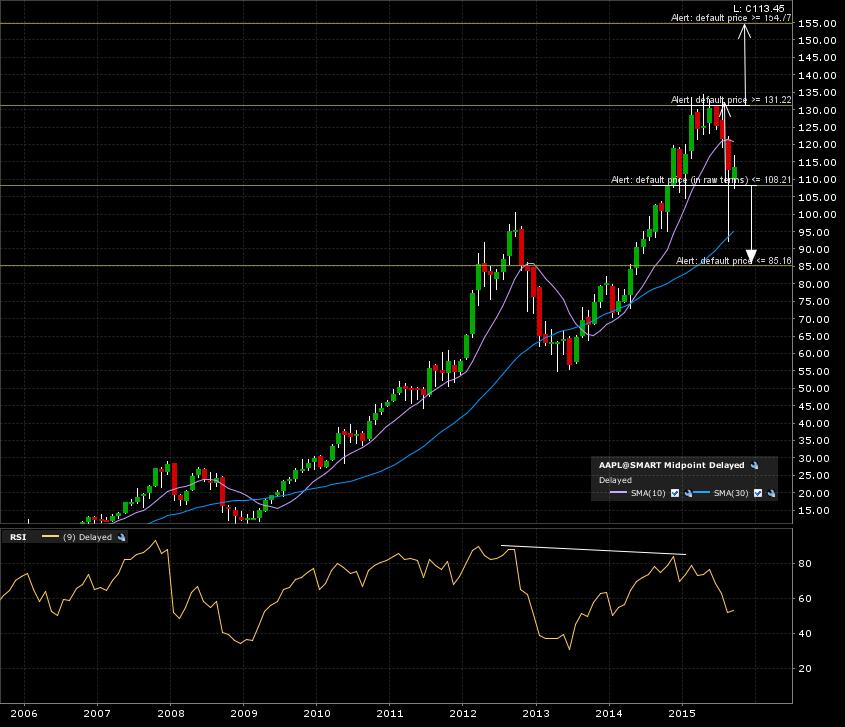
Revisiting Apple after a couple of previous posts. Click here for the one on August 1 and the other February 2. Some morphing has occurred and clearer lines are being drawn for the next pattern to play. Check out the 10 year monthly candle chart. A close above 131 for the bullish breakout ,giving a target of 155. 108 for the bearish breakdown, giving it the 85 target.
 l
l
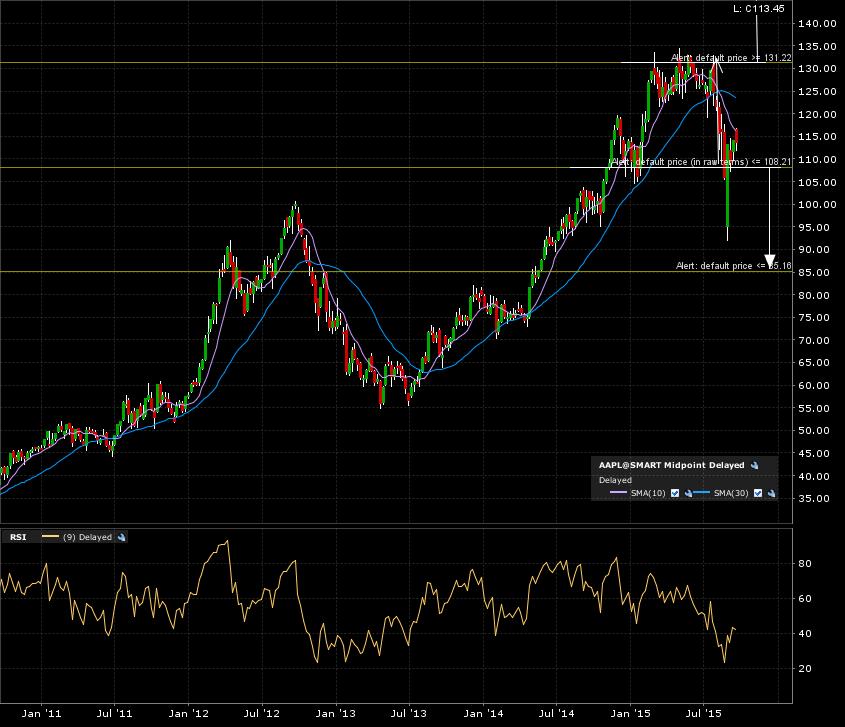
The 5 year weekly candle chart shows some noise below the breakdown line, which can be avoided using monthly candle close to confirm breakouts OR breakdowns. Check this post here to start learning about my concept of “noise reduction“.
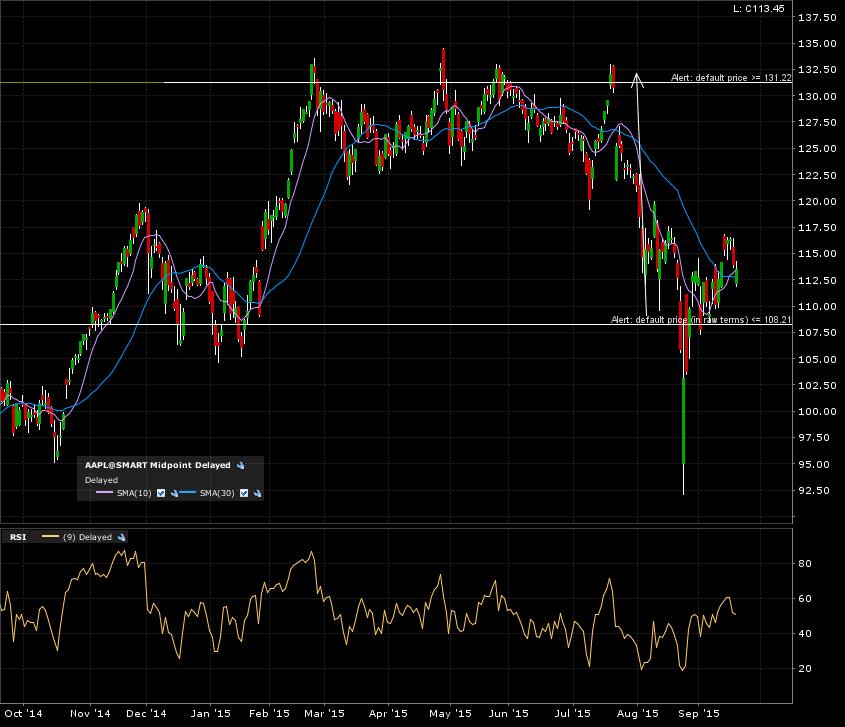
A final zoom in on the 1 year daily candle chart. Even more noise below the breakdown line. Price action right now closer to the breakdown area than the breakout area.
Set your alerts and avoid whipsaws. Just a little more patience to play the larger time frame’s more probable move!