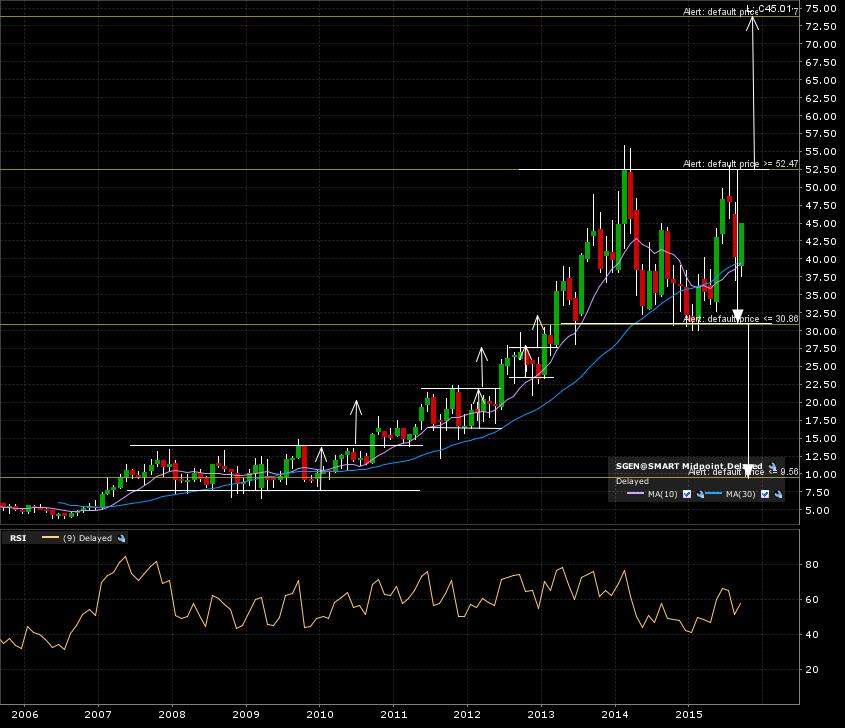
Seattle Genetics Inc. (SGEN:NASDAQ) is currently tracing a large top formation OR maybe a continuation pattern. Let’s look at the 10 year monthly candle chart. I have the bullish breakout with a close above 52.50 and giving a target at 74. The bearish breakdown would be confirmed with a close below 31. It’s target would be 9.50, way back to 2010 levels.
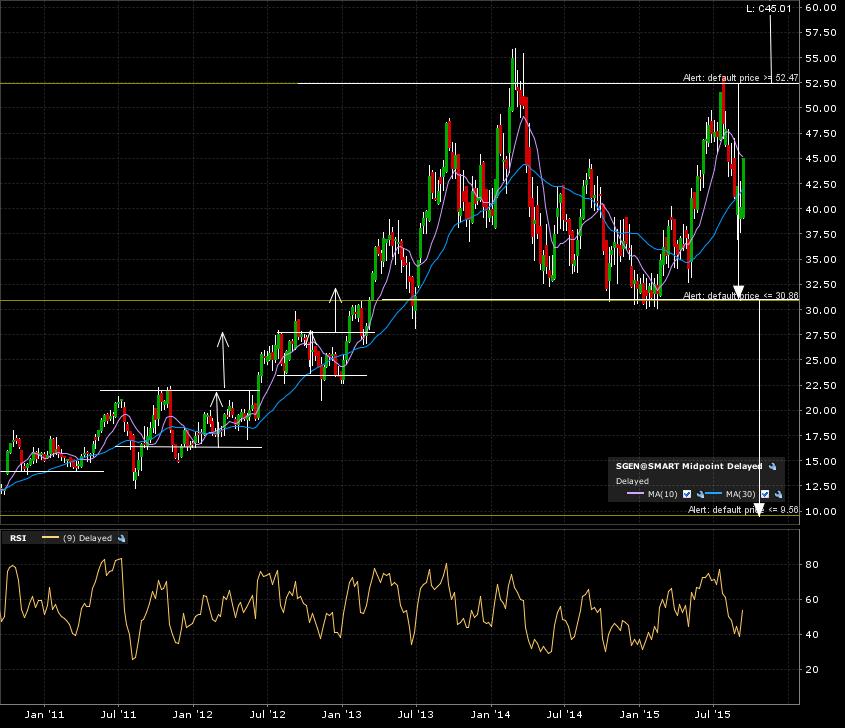
Here is the 5 year weekly candle chart. The price action is getting closer to the bullish breakout line for now.
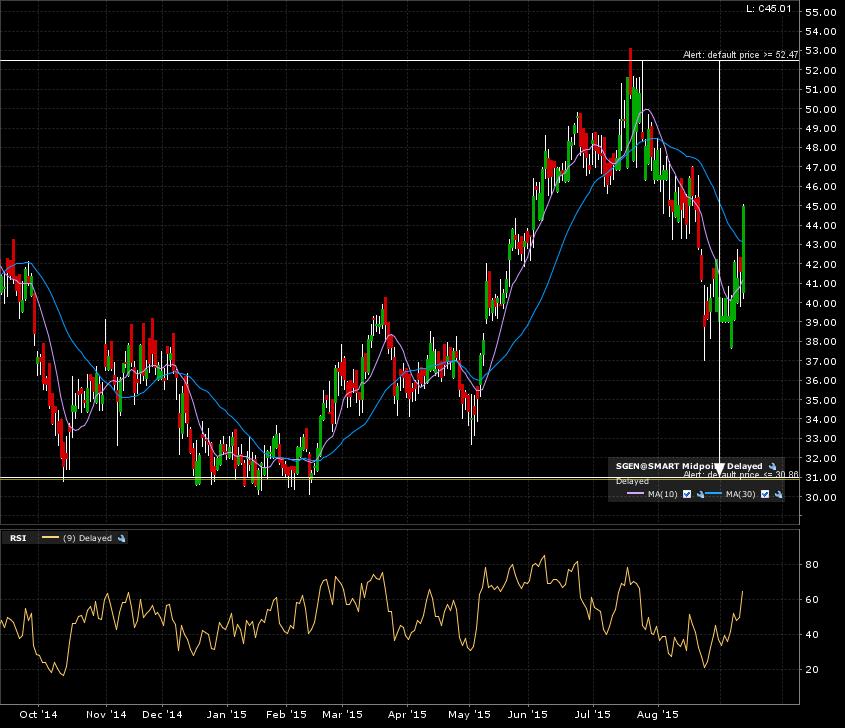
A final zoom in on the 1 year daily candle chart. Price action right now in no man’s land.
My alerts are set. Will have to wait before considering an entry. Right now, just going to view this instrument from afar.