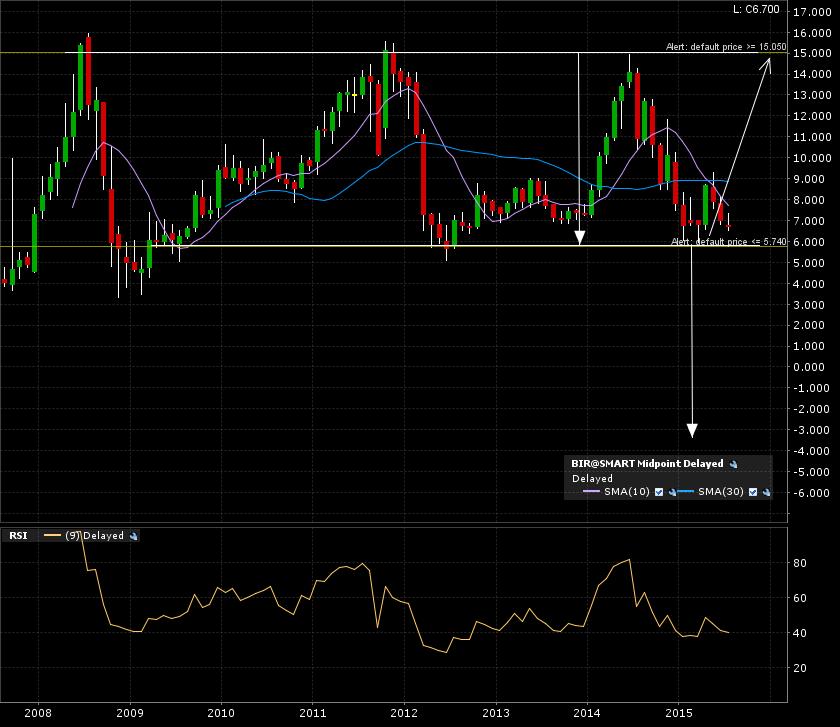
Birchcliff Energy (BIR:TSE) is testing it’s long term lower boundary (support) at the 6 area. A breakdown would bring this to sub zero levels. Another possible scenario is a rebound of this lower boundary and maybe a trend reversal back to prior important resistance at 15. Check out the monthly candle chart.
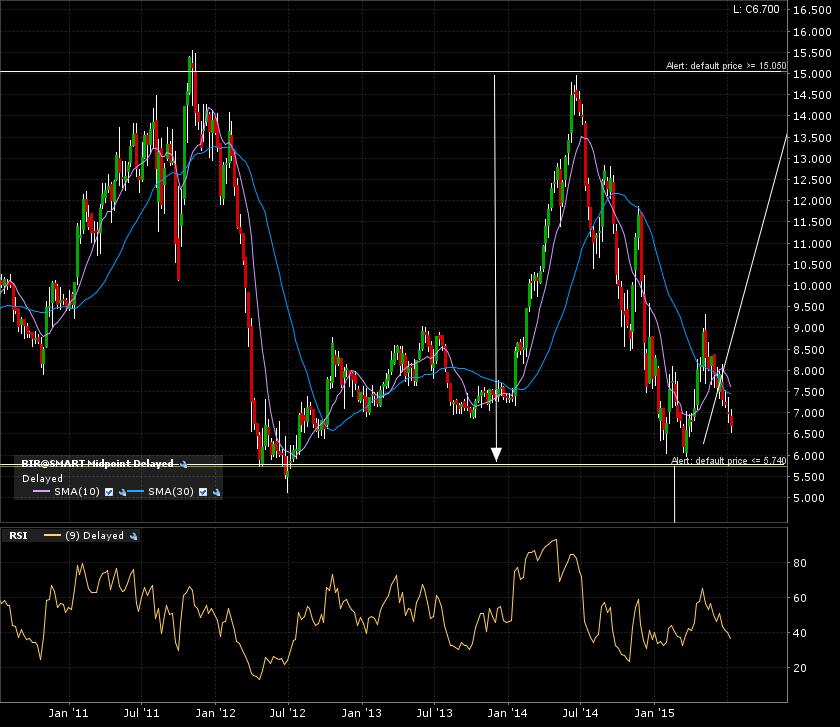
Here is the 5 year monthly candle chart. Lot’s of pressure near the breakdown line.
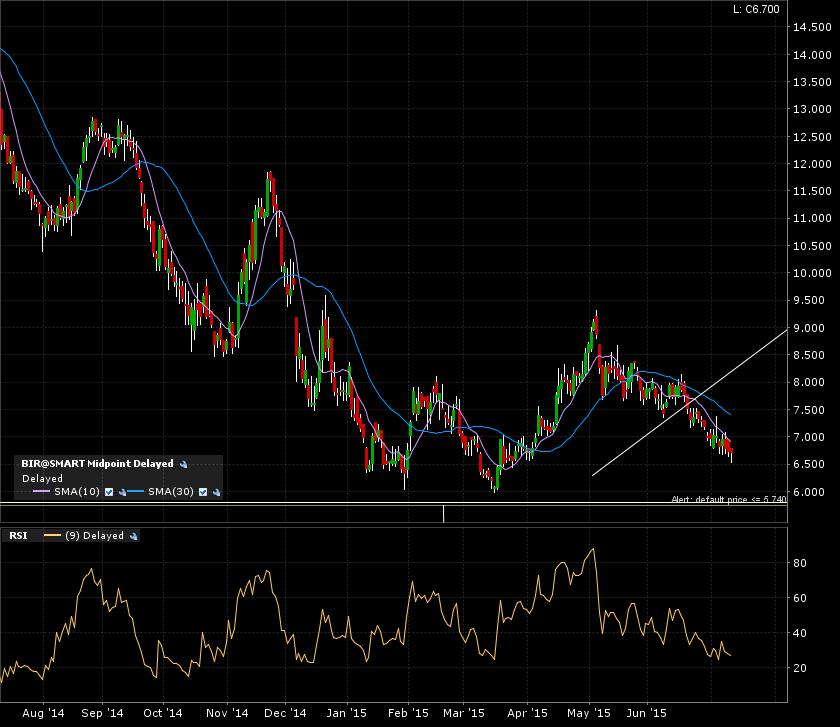
A final zoom in on the 1 year daily candle chart. More of the price action towards the breakdown levels.
I set my alerts. Will come back to this once triggered. So is Birchcliff going to run out of gas OR a second bullish wind is in the cards? Time will tell.