Firstly, check this previous post I wrote back in January. Many months have passed and the Kiwi has fallen, and continues to fall towards the ultimate target of 0.6254.
There is however a possible “WALL” being tested right now, and could be an early exit point around this level of 0.6590. Check this post on my concept of “WALLS”.
Alright, enter the monthly candle chart for the nzdusd forex currency pair.

And now the 5 year weekly candle chart.

Final zoom in on the 1 year daily candle chart.
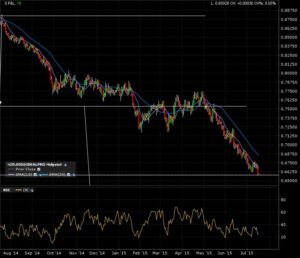
So the Kiwi has fallen from that tall tree. There still might be some squeeze left in the Kiwi, but not much.
I’m going to exit now and wait for the next consolidation period and the eventual chart pattern “morph”.
Check this previous post on “chart morphing”.
See you later nzdusd!