The Bank of Canada has dropped it’s reserve rate from 1.00 to 0.75, now what? Timber!!!! Well, maybe. Check this analysis first.
Huge 5 year top formation in the works for my home country of Canada!
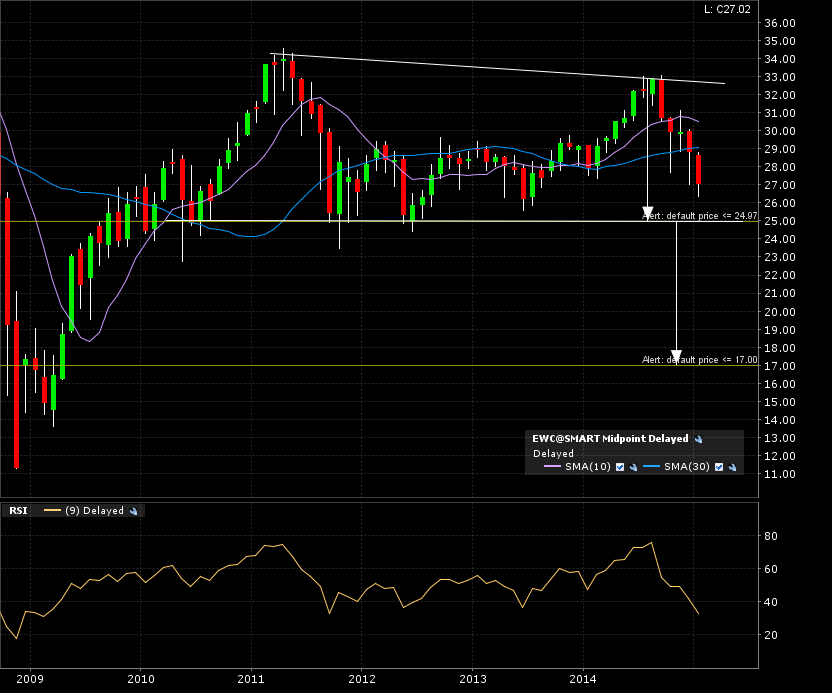
Here is the Ishares MCSI Canada ETF monthly candle with 6 years of data. We can observe a trench line at the 25 mark. If broken and closed under, I have an implied measured move to the 17 mark. That’s in the late 2008- early 2009 crash range, yikes!
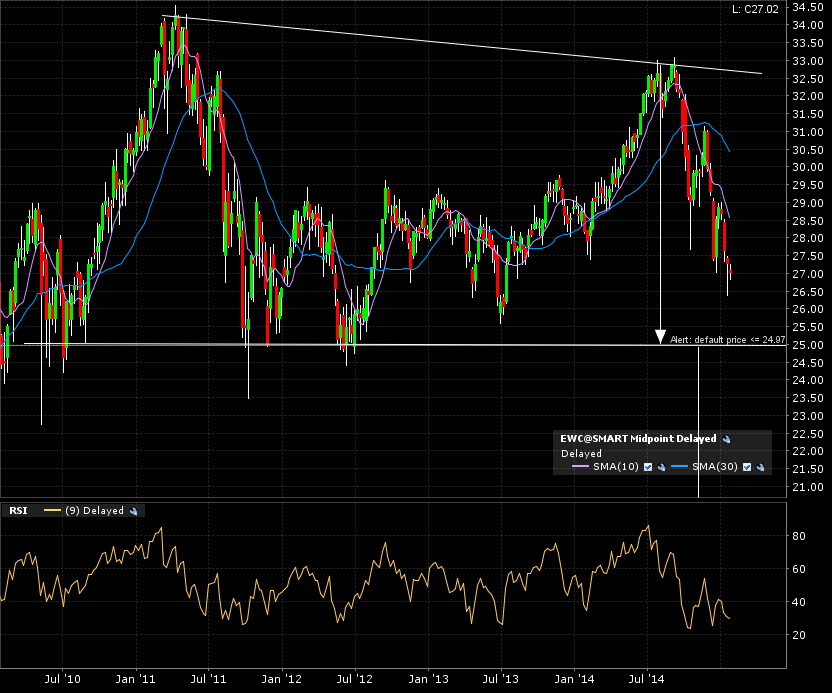
The weekly candle 5 year chart shows us the gap closing towards a test of the important support area. Remember, the more times a support tested, the stronger the move once broken. I believe that gives me a higher probability of reaching my possible target.
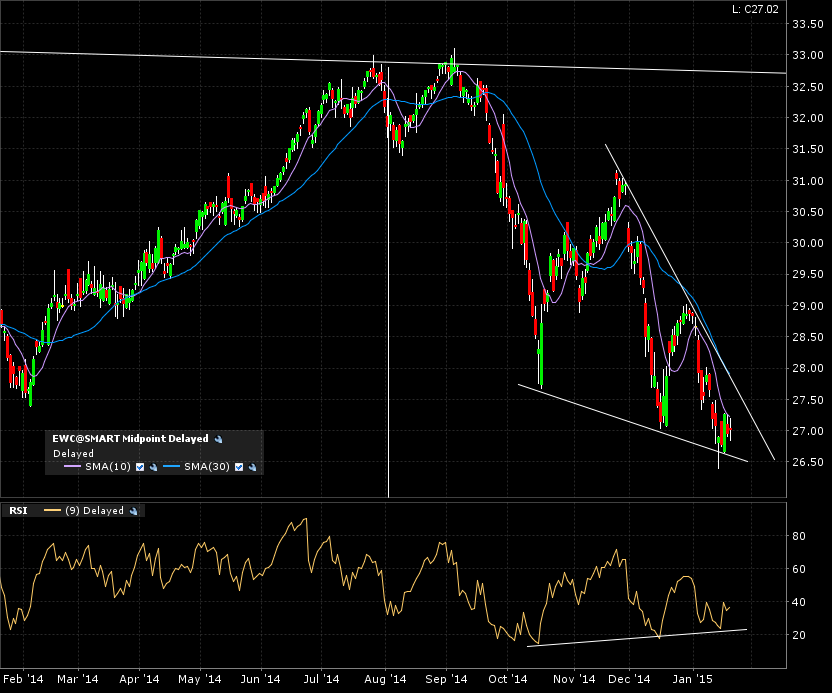
Glimmer of a hope for a bullish bounce off that support? The falling wedge pattern (often a reversal pattern) with some consistent bullish divergence with the RSI on the daily candle 1 year chart would point to that.
Again, this is a “set alerts and keep an eye on” type of setup. I want to be ready for this breakdown, IF it happens, because that HUGE top will put this in the A+ category.