LinkedIn (LNKD:NYSE) is testing it’s ascending trend line (support) at 190. A break below it would bring forth a possible test of the more important horizontal support line of the +2 year top formation at 150. After a failed breakout in Feb 2015, the chart has morphed into a new pattern. The bullish scenario is no longer valid and we now have a new bearish scenario to consider.
Check this important post on chart morphing, and why it is crucial to have proper risk and money management protocols in place in case the played move doesn’t pan out the way we hoped.
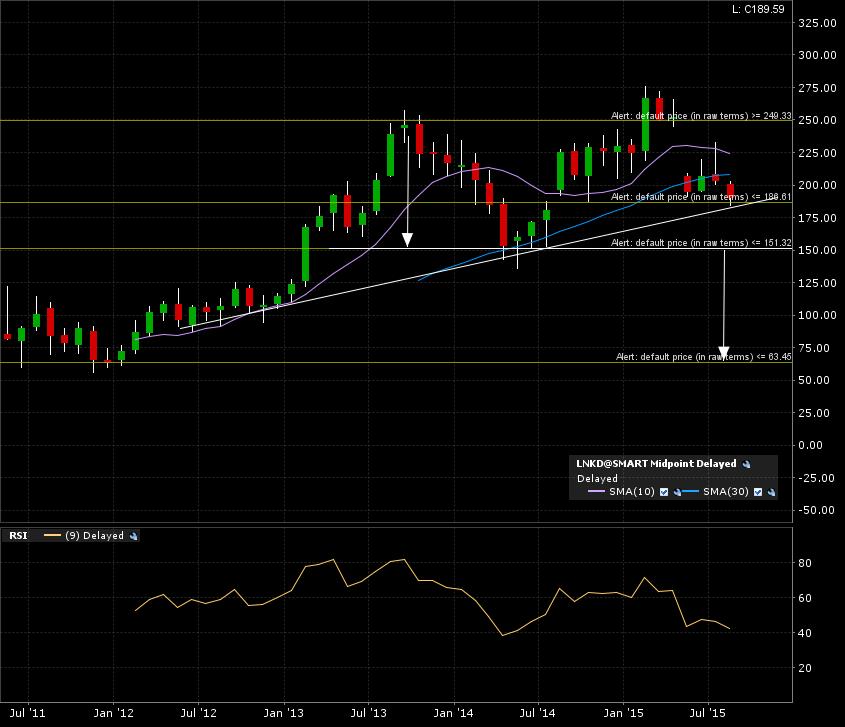
Here is the monthly candle chart. I rather wait for the horizontal support line break before entering. I believe horizontal support lines give more value to the possibility of reaching my probable target.
The furthest bearish target is 65. There may be an exit at 125 area, since a previous WALL is there (resistance turned support from a previous breakout). Check this post on my concept of WALLs.
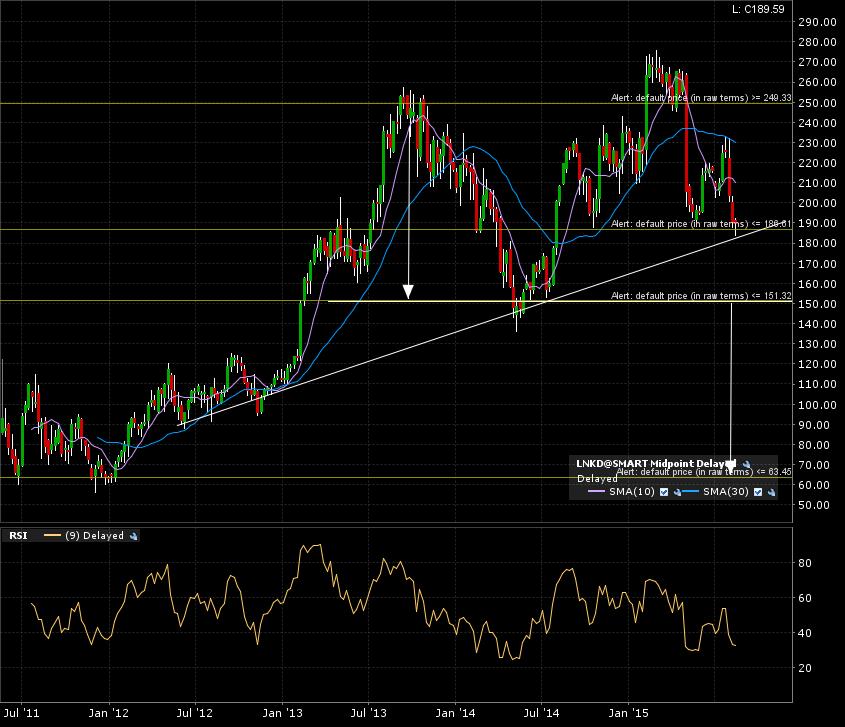
Here is the weekly candle chart. The failed breakout above 250 is clearly visible. Now approaching the 150 break down line.
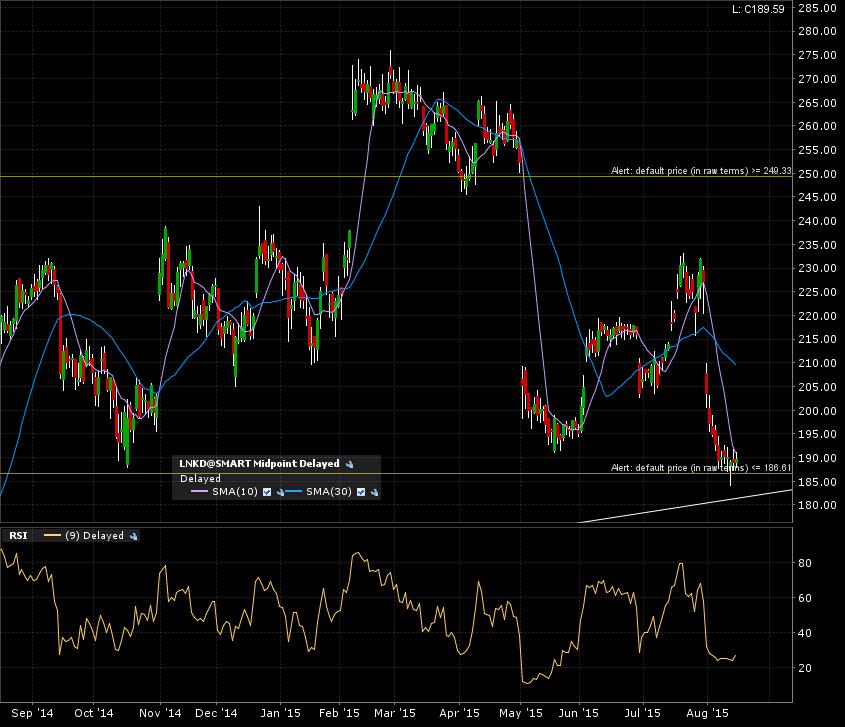
Here is a final zoom in on the 1 year daily candle chart. The support area at 190 has been tested a few times in this time frame.
I set some alerts and will come back later see if the weak link will break OR hold up for the next bullish move.