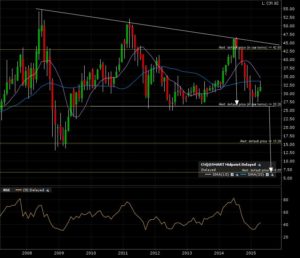
Canadian Natural Resources Limited (CNQ:NYSE) is carving itself a HUGE top formation. Check out the 8 year monthly candle chart. A recent bounce off the breakdown line (support) at 26. A monthly candle close below that will give a target of 7. Notice the alert I put at the 15 mark. That is a possible WALL due to previous important support at that level. An exit would be considered there.
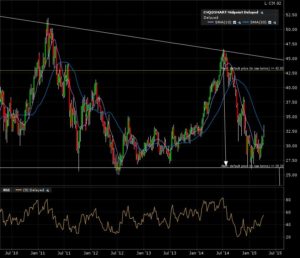
Here is the 5 year weekly candle chart. The lines are being drawn. Maybe another bounce off the upper descending trend line? My alerts are set for either case.
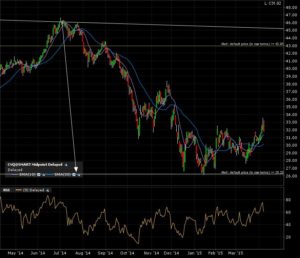
Zoom in on the daily candle 1 year chart. Price action right now in no man’s land. Patience required.
So it’s way to early to play CNQ. Just watch this graph develop over time and see what happens. I’ll move on to other charts for now.


