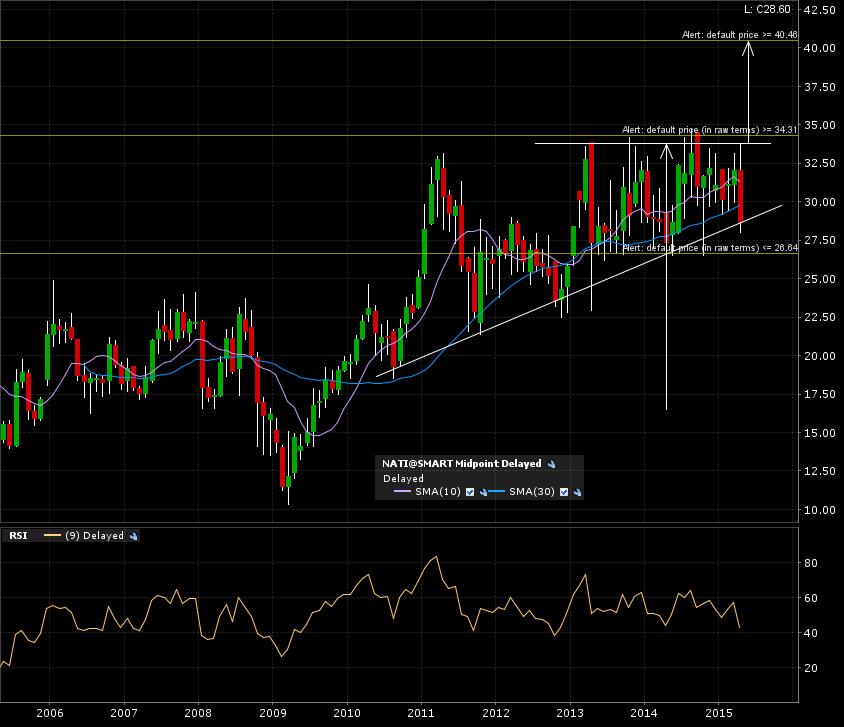
National Instruments Corporation (NATI:NASDAQ) is testing it’s ascending lower trend line boundary. But I’m looking at the bullish picture, which seems clearer. Here is the 10 year monthly candle chart. The arrows are the implied measured move added to the breakout line. In this case, 34.50 is the breakout line (resistance) and 40.50 it’s target. A monthly candle close above the breakout line is necessary for confirmation.
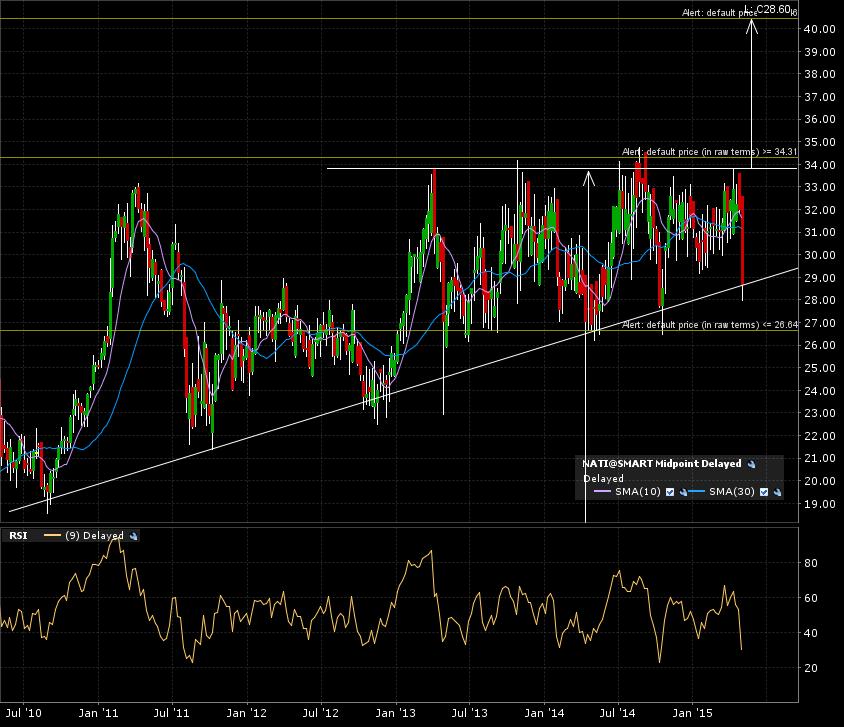
The 5 year weekly candle chart shows the “ascending triangle” classical chart pattern (usually a bullish continuation) in progress with some noise below the ascending trend line. Check this previous post on how to avoid whipsaws caused by price action noise.
The zoom in on the 1 year daily candle chart shows the recent gap down hitting the support.
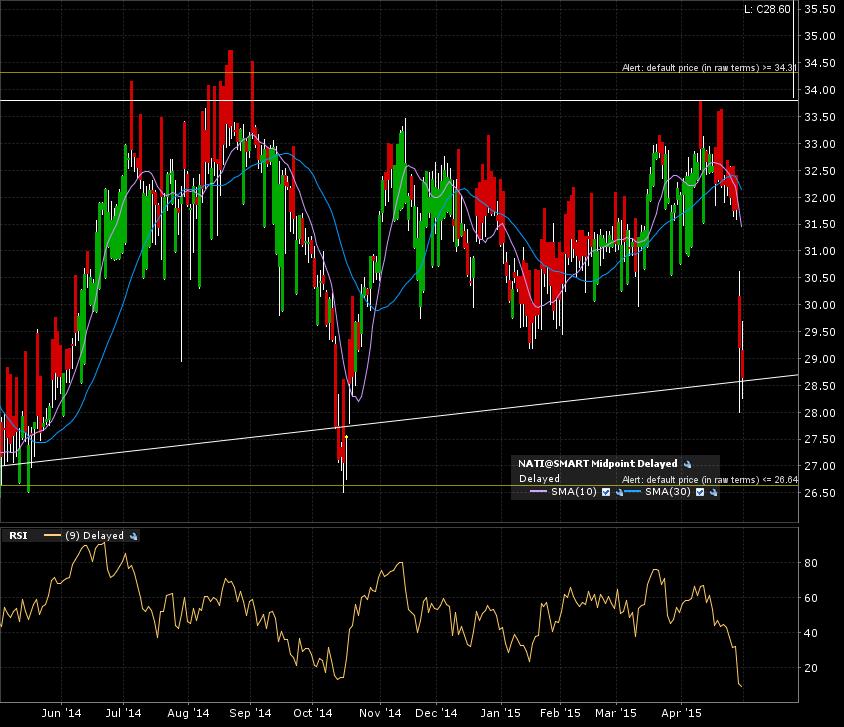
I set my alert for the bullish breakout. The scenario right now looks bearish. Will have to wait and see.