Skip to content
Fri. Apr 26th, 2024
Bad * Charts' Archive
See northstarbadcharts.com for latest updates
See northstarbadcharts.com for latest updates
Search for:
Search Button
On April 6, 2023
Our latest 48 minute talk with Kitco News
On April 4, 2023
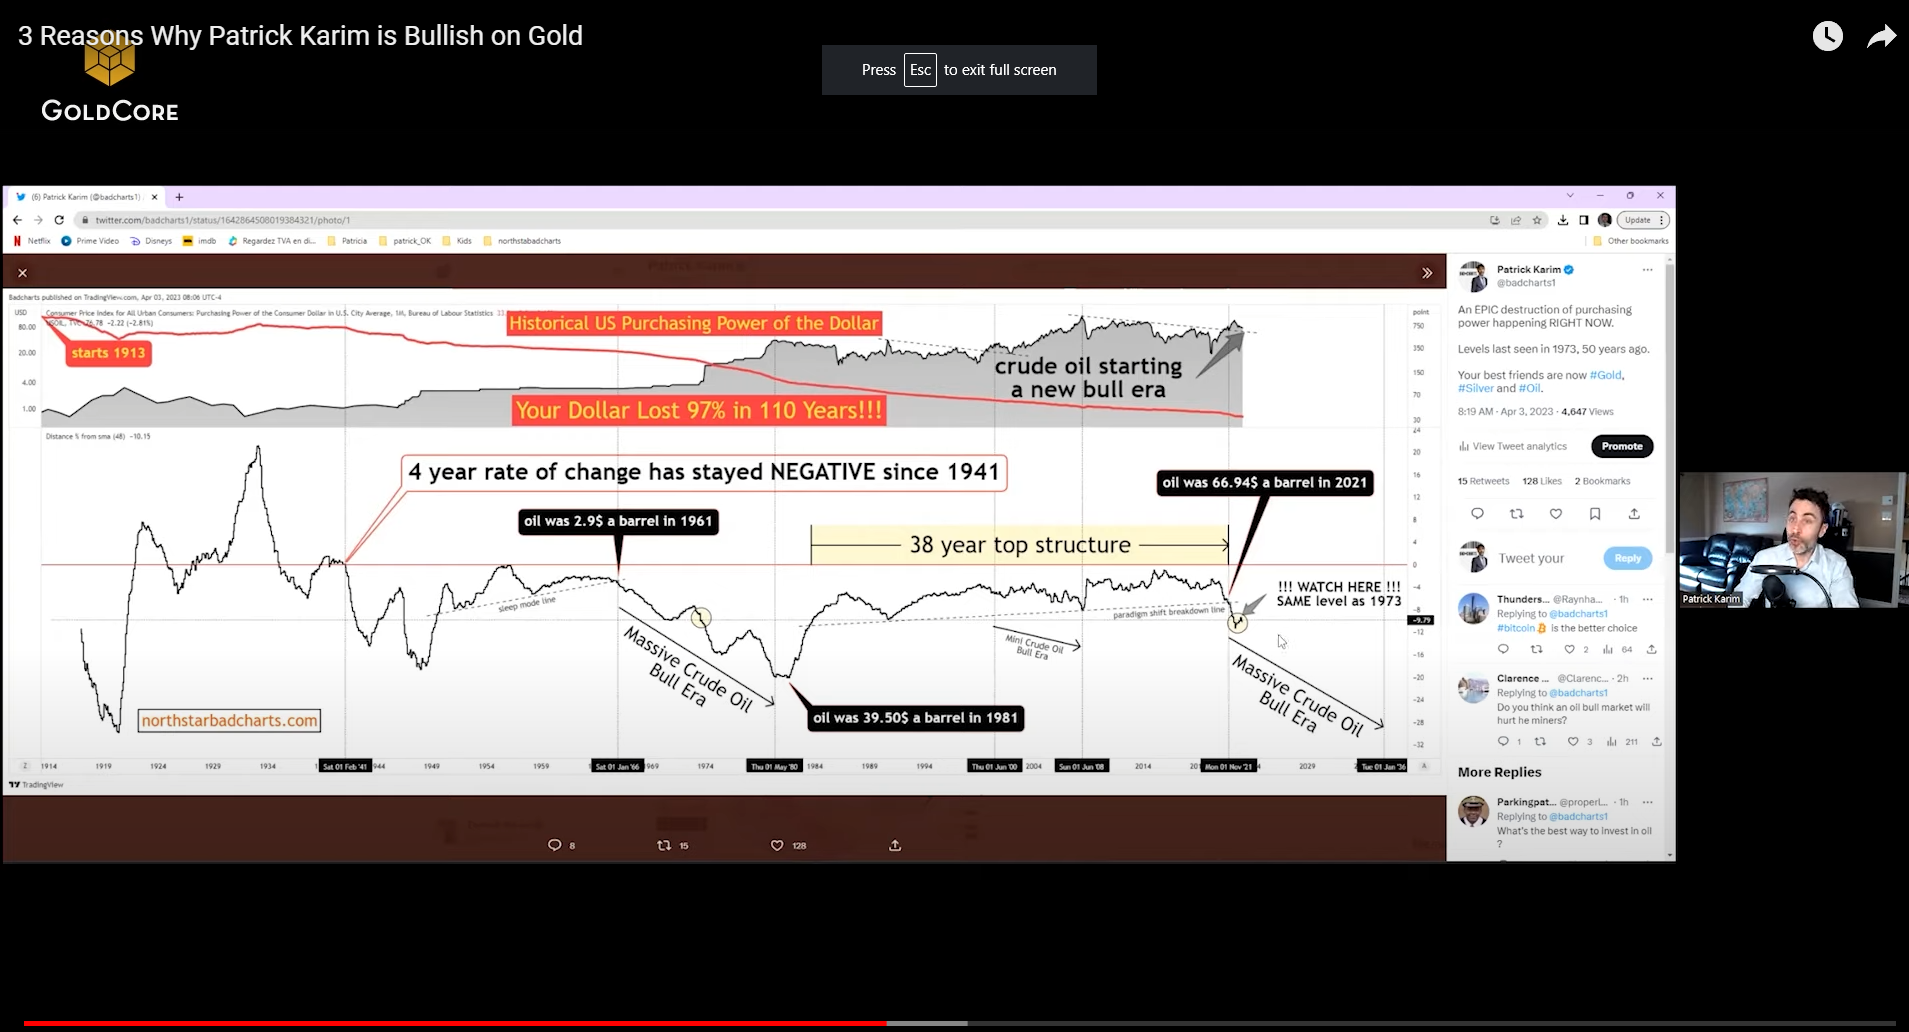
3 Reasons Why Patrick Karim is Bullish on Gold
On February 23, 2023
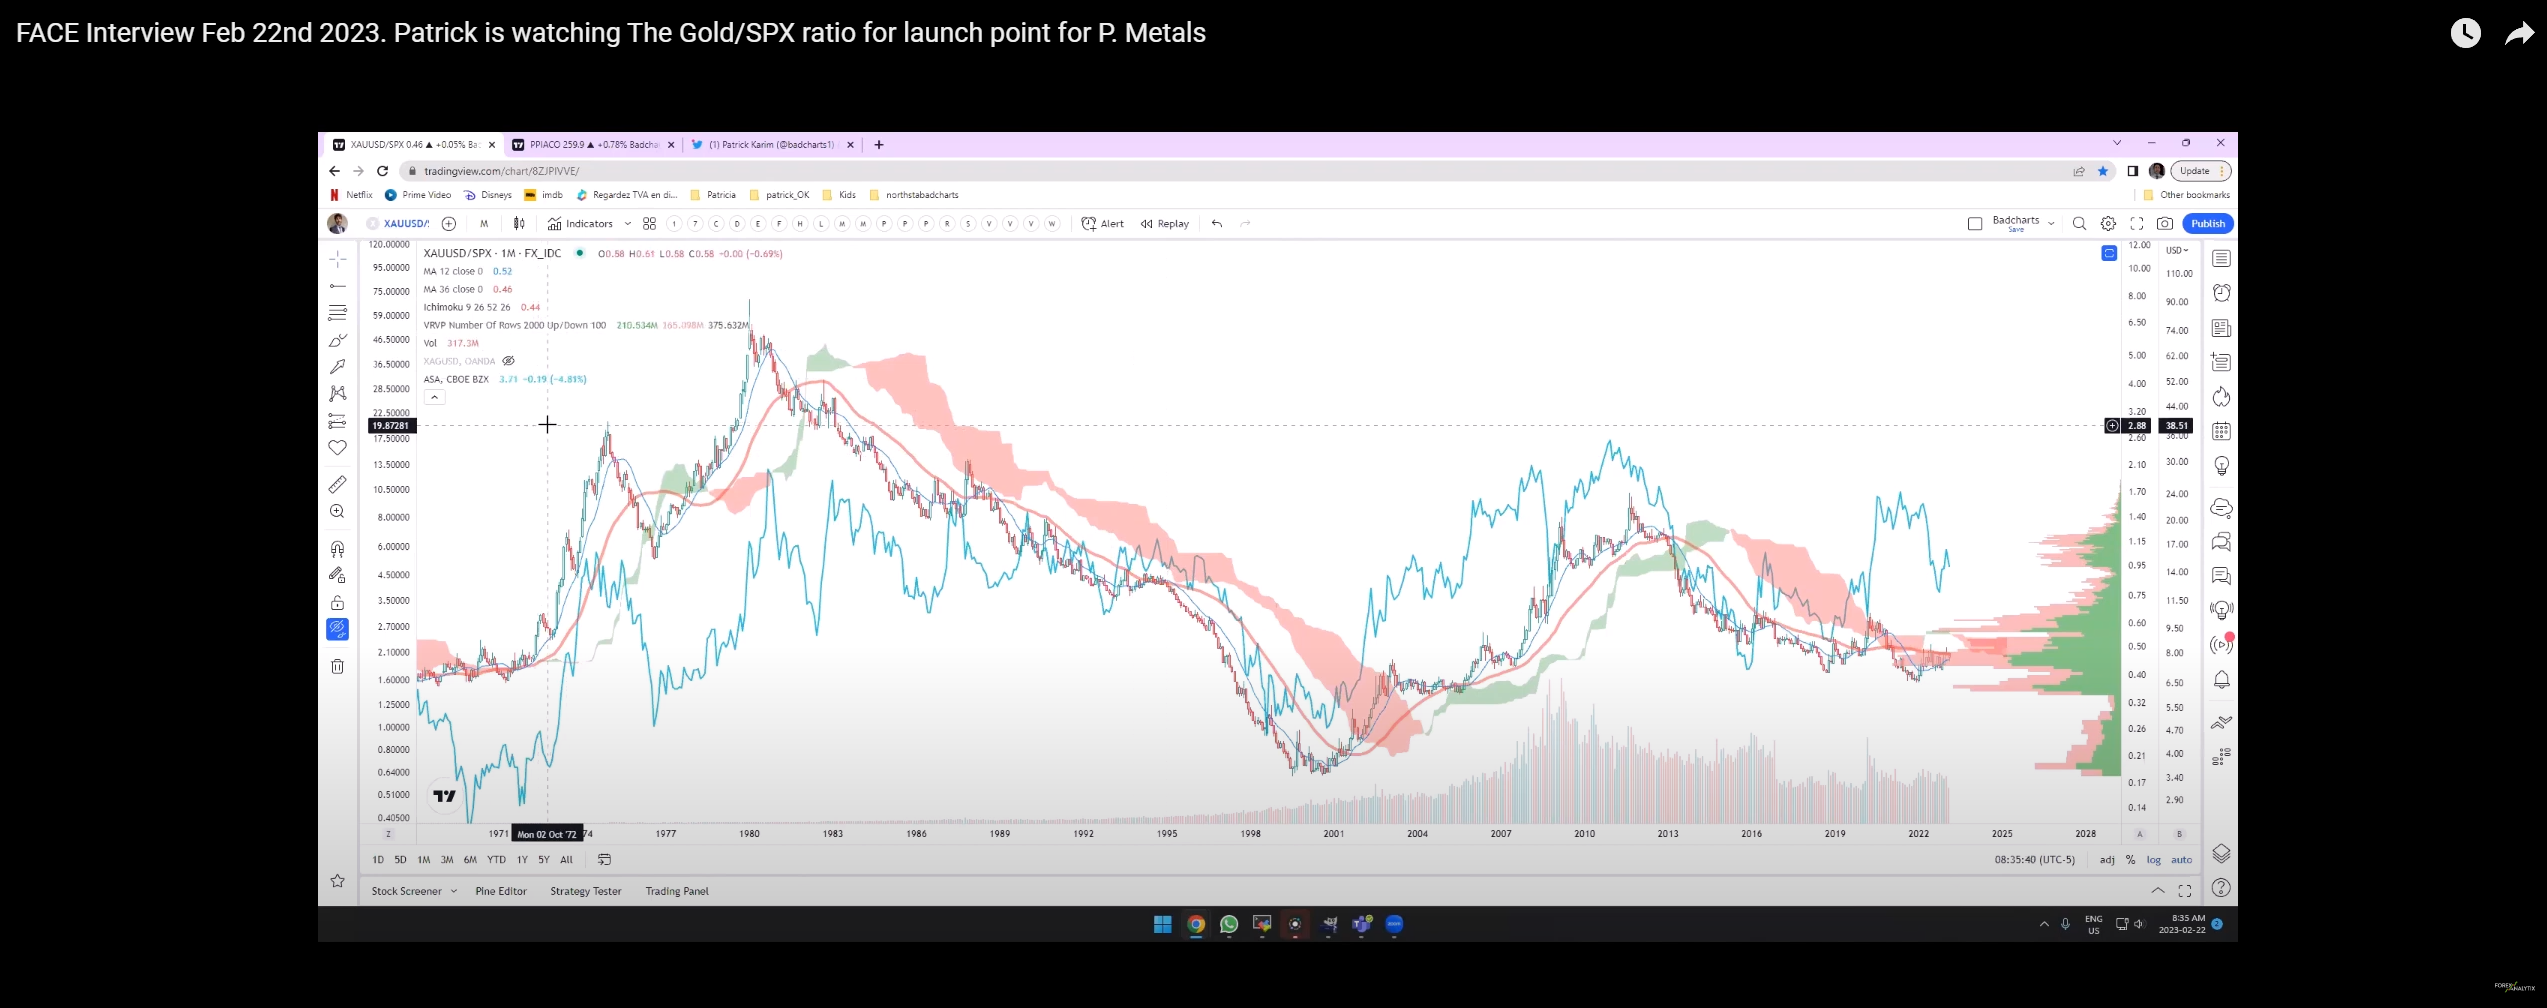
Latest 30 minute talk with Dale Pinkert
On January 29, 2023
Debt Bubble About to Pop? What’s Next For Silver & Gold!
On January 18, 2023
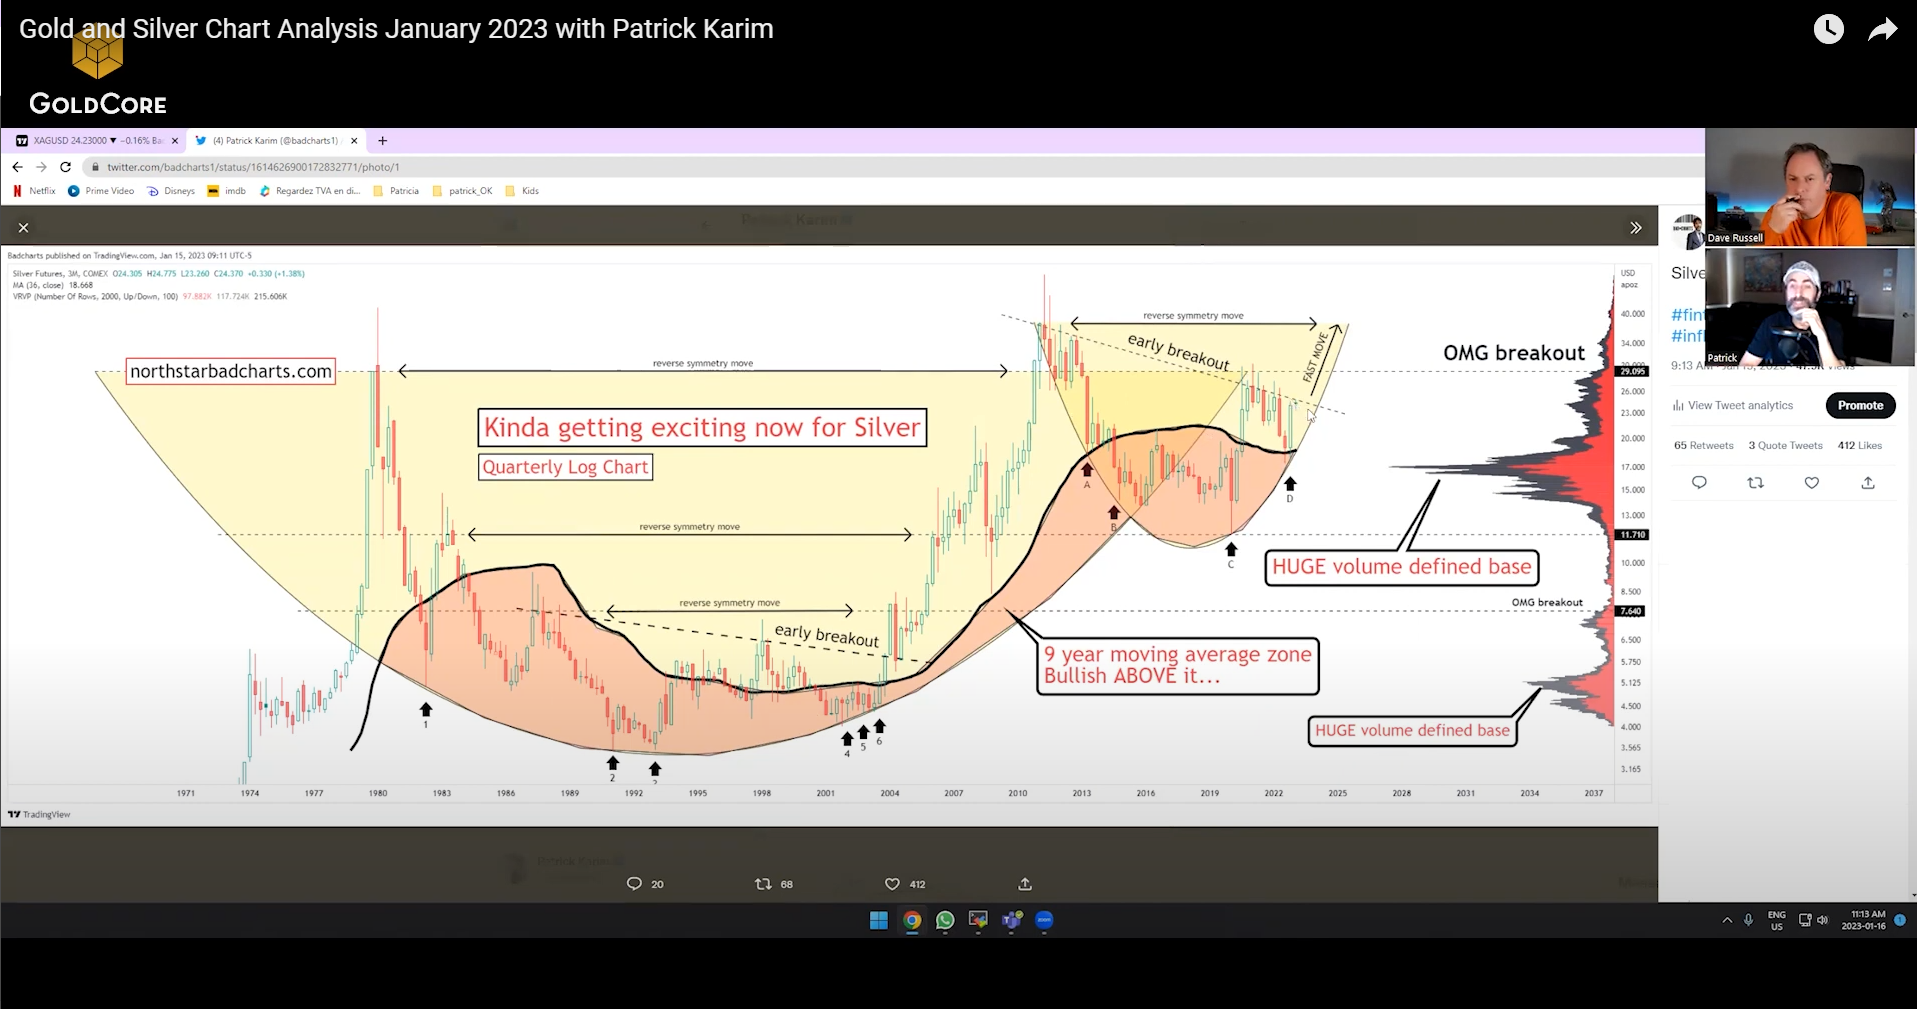
Gold and Silver Chart Analysis January 2023 with Patrick Karim
On January 18, 2023
Changes To The Dollars Value May Be Right Around The Corner
On January 7, 2023
Patrick Karim: Charts Hold the Key to Big Breakouts for Gold
On January 6, 2023
2023 outlook for gold, Bitcoin: One of these could go to $3k – Northstar & Badcharts
On November 29, 2022
Sorry Bitcoin bulls, a new high soon is ‘total nonsense’, stocks may not bottom until 2031
On August 17, 2022
Our Latest Interview on KitcoNews
On August 17, 2022
Patrick Karim: Crippling Debt Loads will Crush Economies
On July 7, 2022
15 minute talk with Economic Ninja
On July 5, 2022
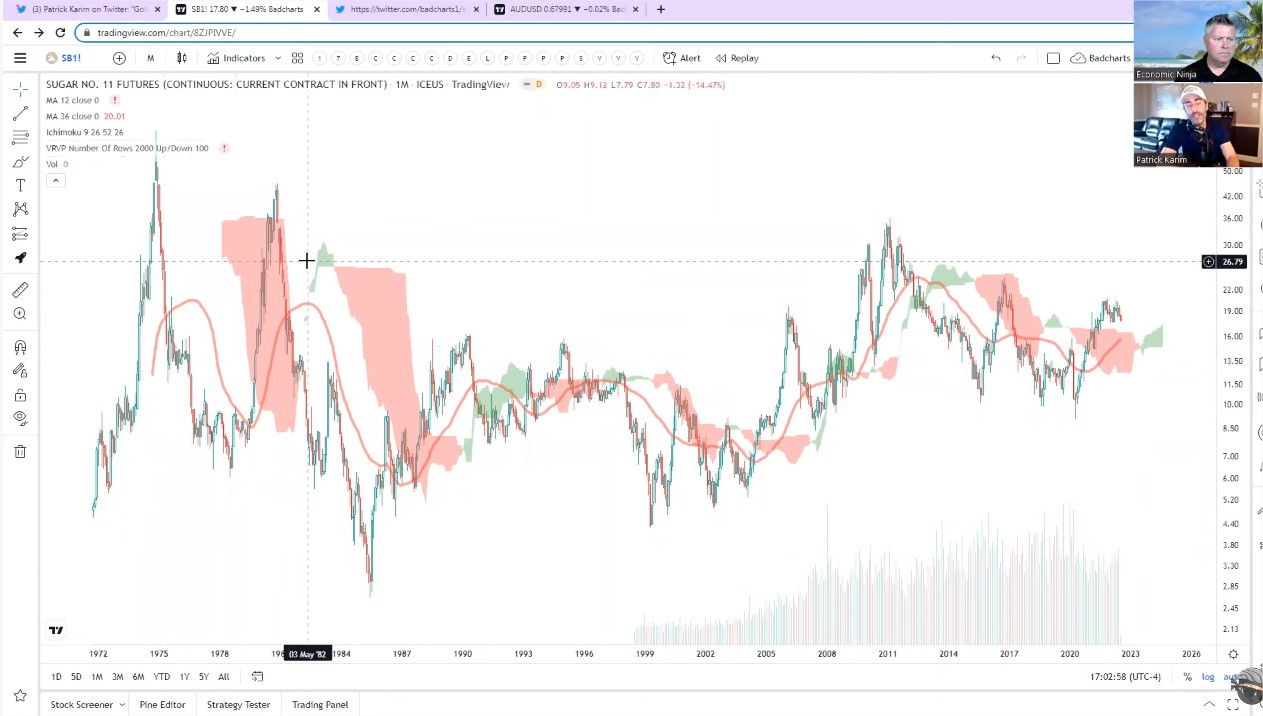
8 minute talk with Wall Street Ninja about sugar
On July 4, 2022
40 minute talk with Kerry from Small Caps
On June 28, 2022
Summer Sale – 60% discount off yearly memberships – LIMITED QUANTITIES
On June 3, 2022
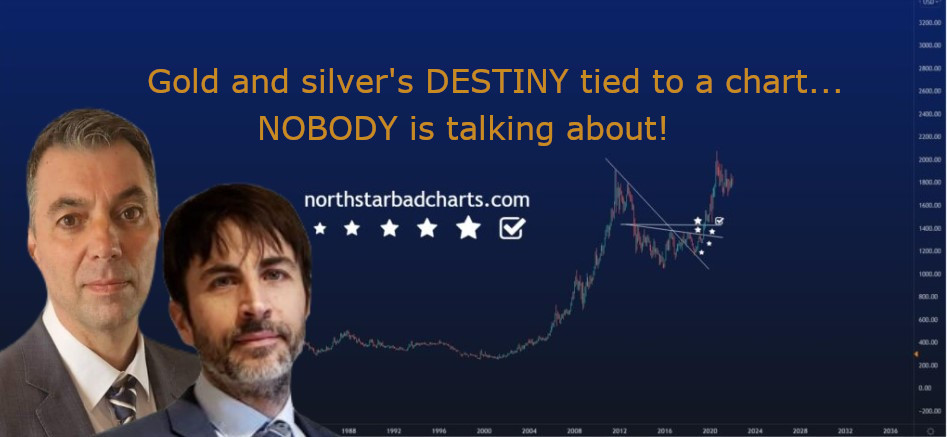
Gold and silver’s DESTINY tied to a chart NOBODY is talking about!
On May 13, 2022
30 minutes with Andrew Maguire
On May 11, 2022
21 minutes with Wall Street Ninja
On May 11, 2022
30 minutes with GoldCore TV
On May 9, 2022
David Lin from KitcoNews interviews northstarbadcharts.com!
On April 12, 2022
As The CPI Inflation Just Hit 41 Year Highs The Breakout For Gold Tells Us Something Big Is Coming
On April 5, 2022
17 minutes on SBTV’s MetalMoney
On April 2, 2022
Is Gold and Silver ready for a Big Bull Market ??
On March 16, 2022
Talking with Antonio – GDI vs Gold
On March 15, 2022
70 minute talk with Palisade Radio
On February 17, 2022
The Market Sniper talks Silver, Gold and the US Dollar
On February 17, 2022
The Power of Technical Analysis with BadCharts
On February 7, 2022
Michael Oliver is back on our show!
On January 29, 2022
20 minute talk with the Economic Ninja
On January 25, 2022
Talking with SB Bullion TV
On January 25, 2022
30 minutes with Kai from Soar Financial
On January 11, 2022
A special “vintage” Badcharts podcast
On January 8, 2022
The Largest Wealth Building Opportunity in Commodities?
On January 8, 2022
80 minutes with Andy from Finding Value Finance
On December 21, 2021
Here is the unlisted full 77 minute interview
On December 17, 2021
Talking with Coach Dale
On December 10, 2021
Separating Peak Stupid from the Valley of Despair
On December 3, 2021
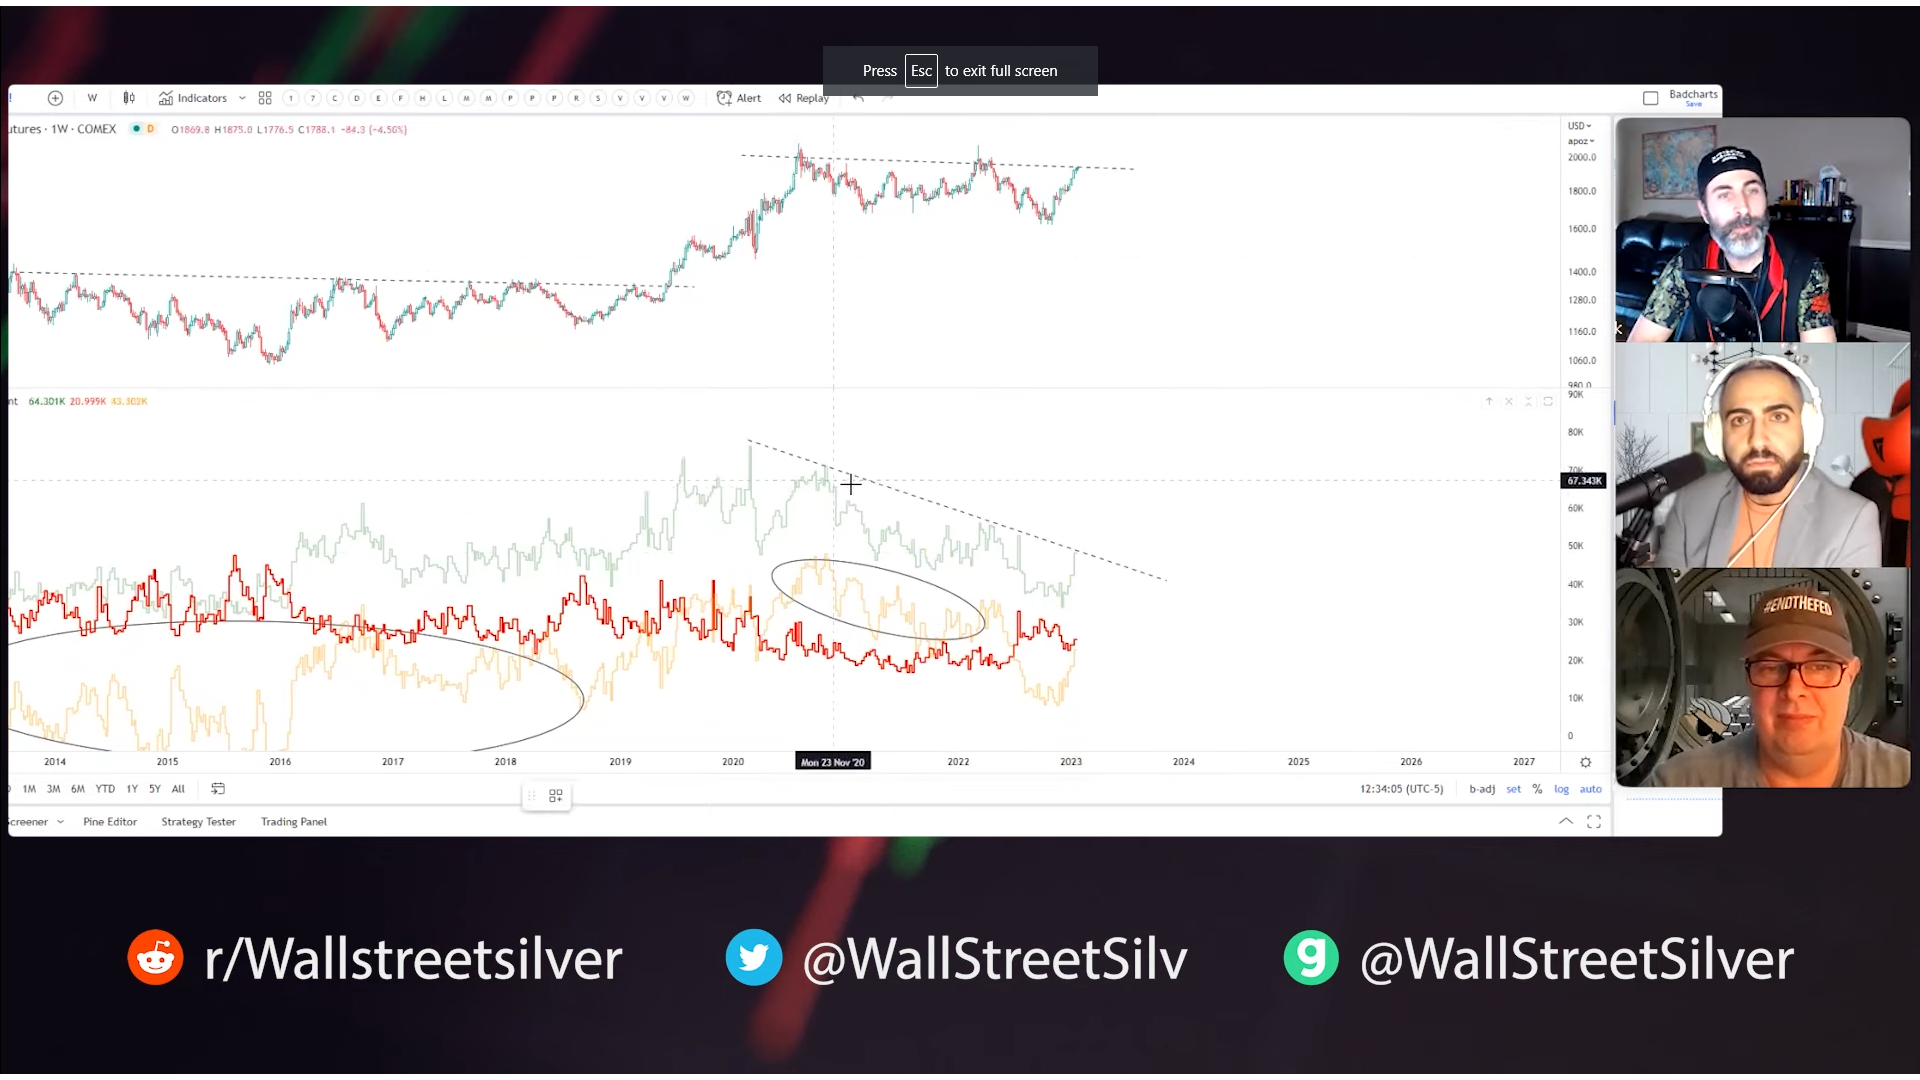
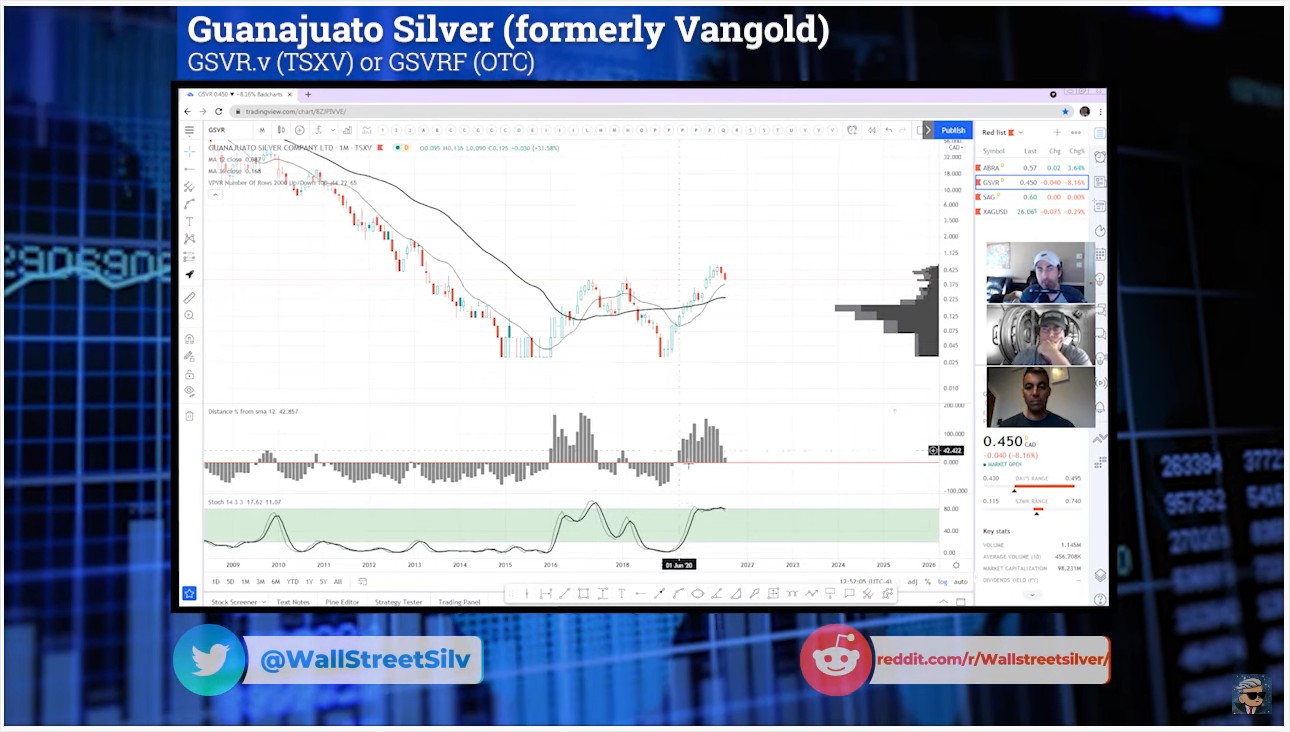
Talking Big Picture with Wall Street Silver
On November 11, 2021
By 2024, gold price will double, silver will more than triple, here’s why – Patrick Karim
On October 13, 2021
Gold’s Trajectory to $6,200 as Forecasted in Fibonacci Circles
On August 28, 2021
Inflation is JUST starting… Showcase by BlackBeard Research Report
On August 28, 2021
FACE Interview with Dale Pinkert
On August 23, 2021
HAA
On August 17, 2021
Talking Silver, Gold and US equities with David Lin on Kitco News
On July 28, 2021
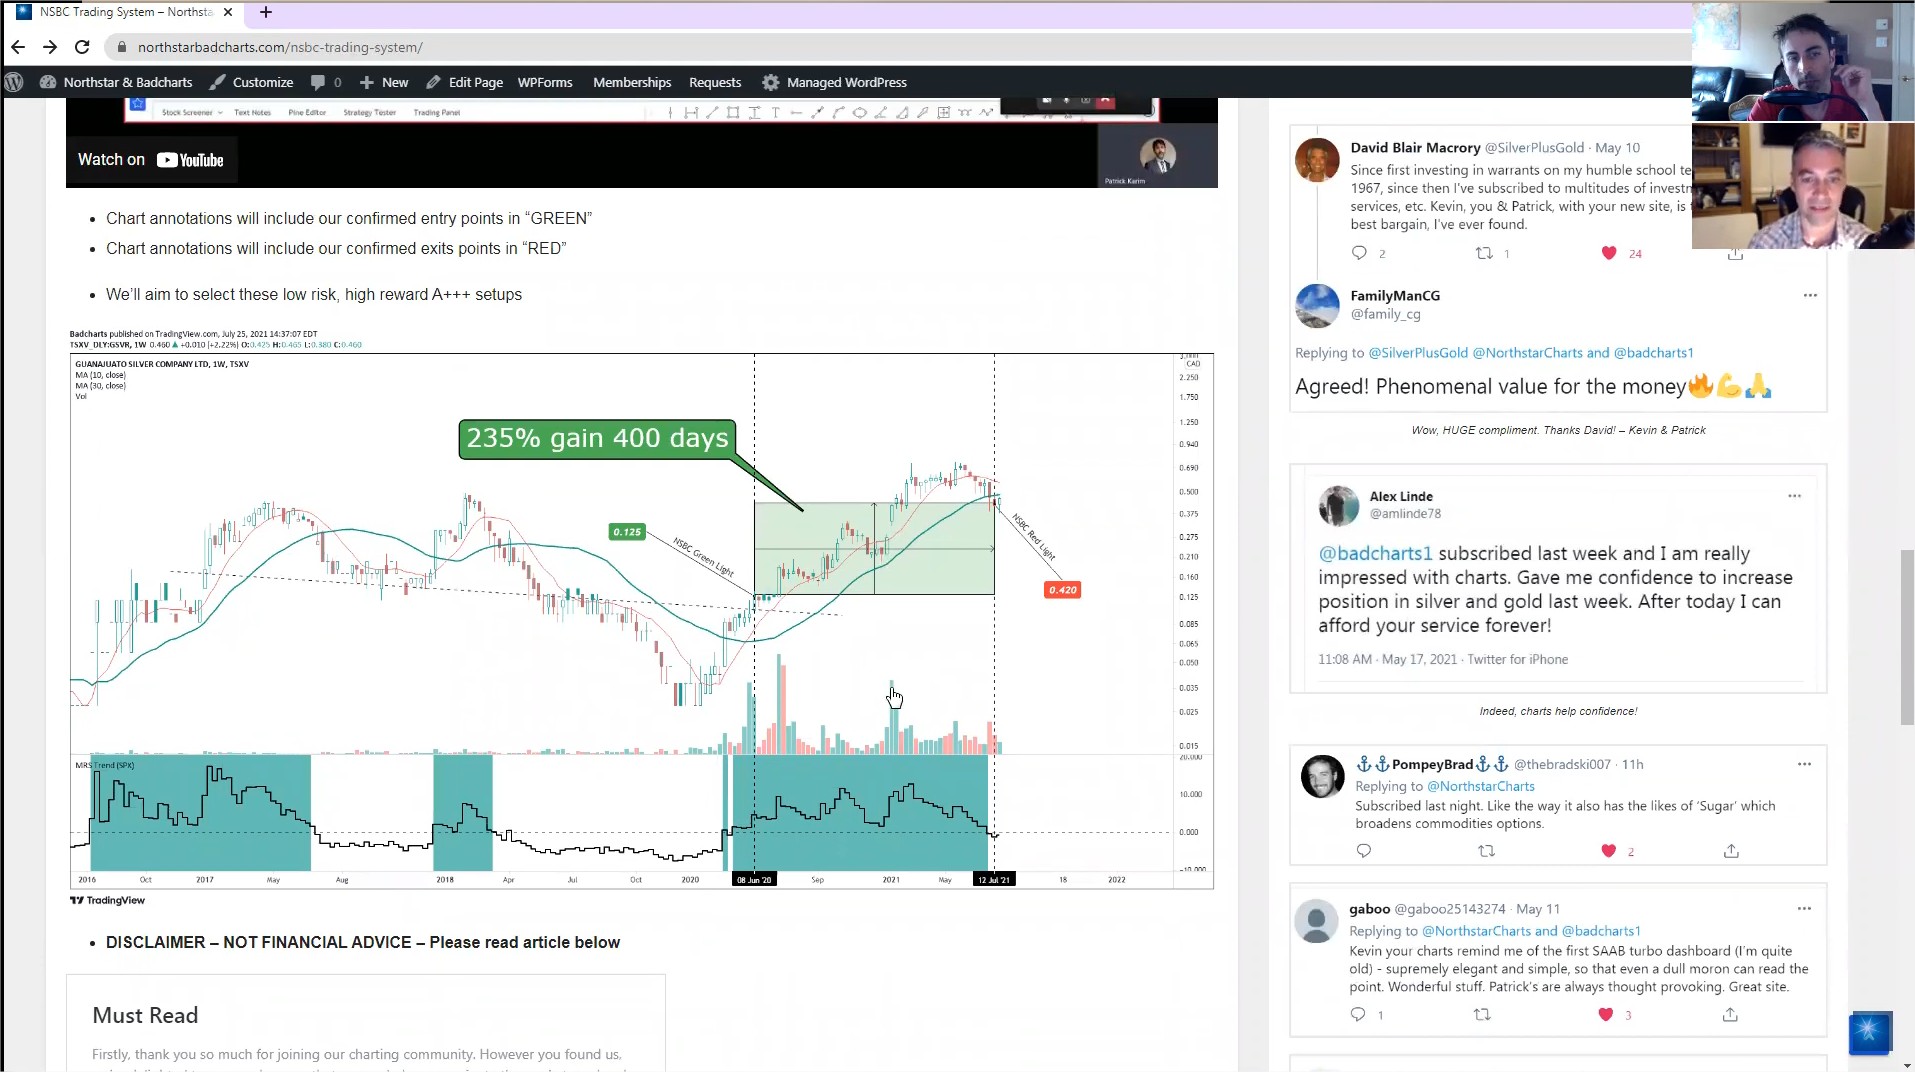
Introducing our “NSBC Trading System”
On July 22, 2021
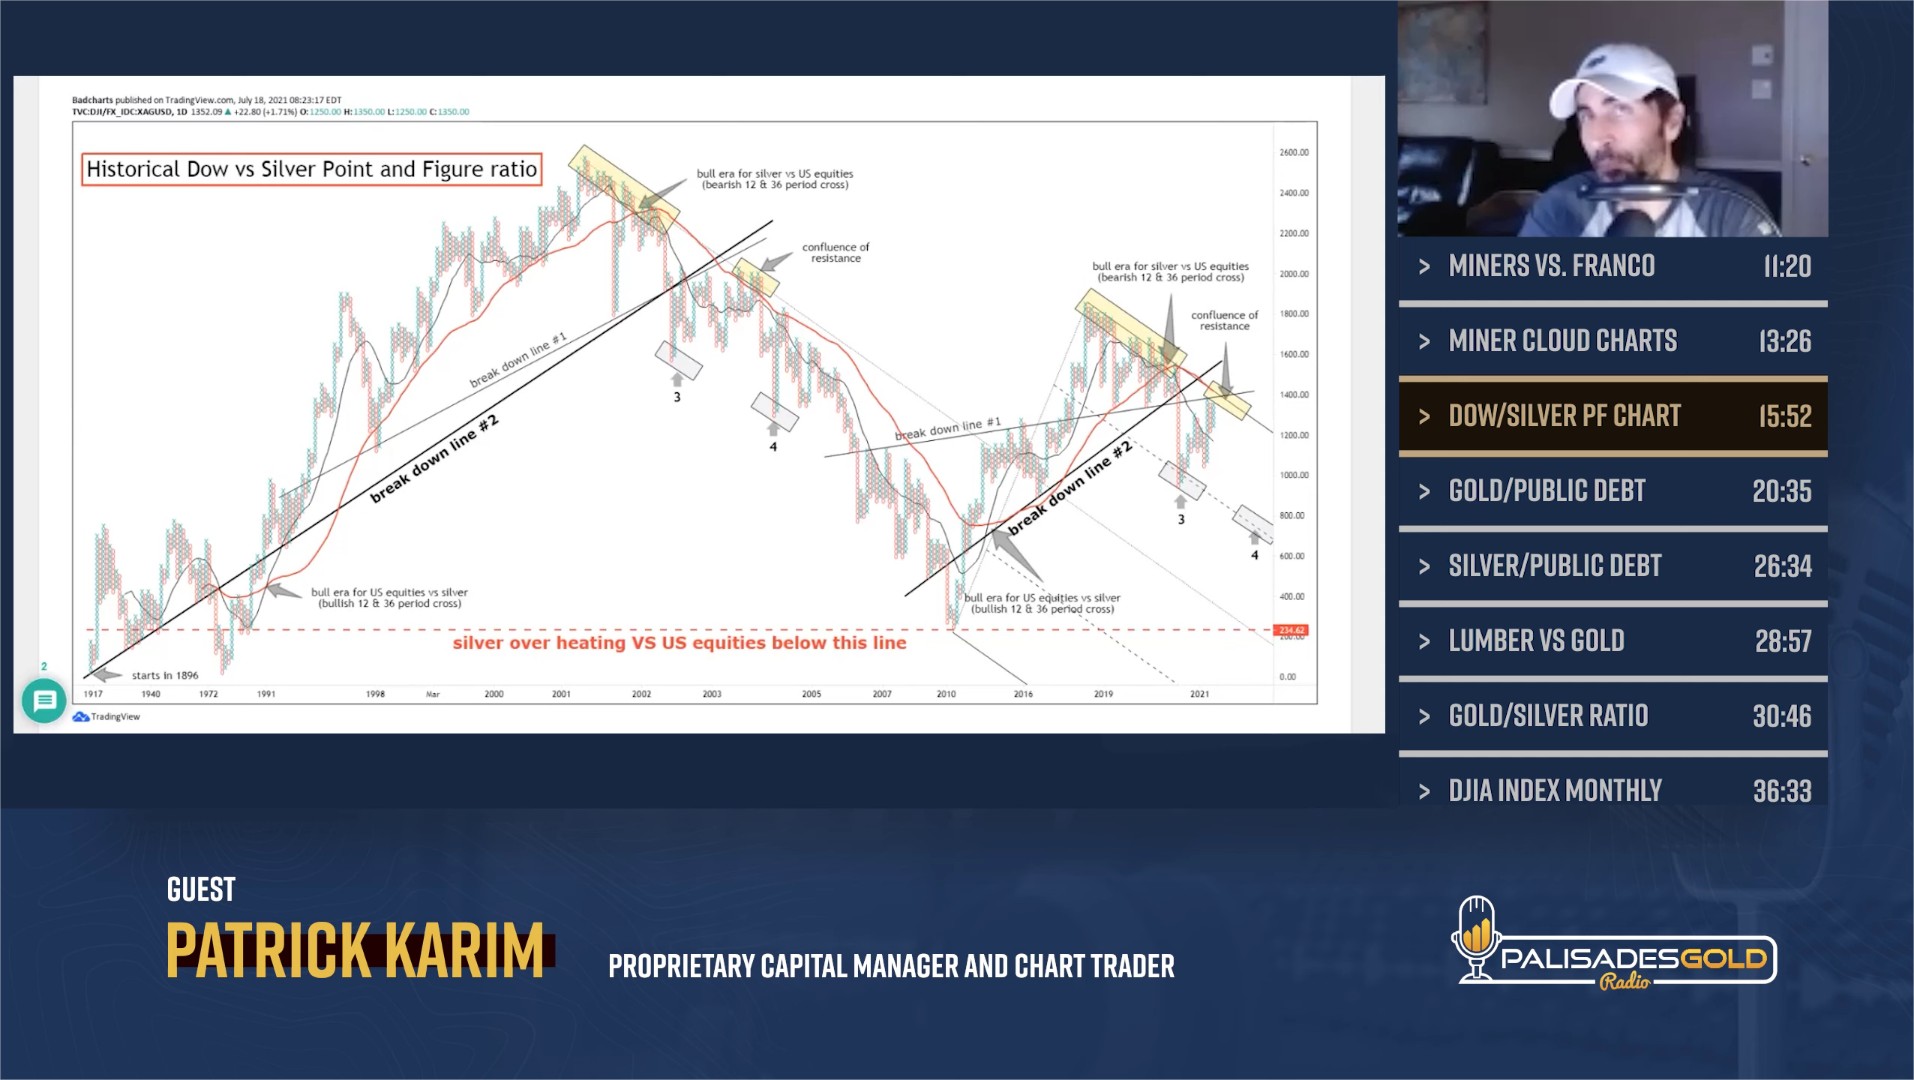
Patrick Karim: Lines in the Sand for Gold and Silver
On July 12, 2021
Talking Gold and Bonds with Peter Grandich
On July 8, 2021
Top Eric Sprott Silver Stocks – Patrick Karim & Kevin Wadsworth
On July 5, 2021
A Gold Miner’s Tale
On June 28, 2021
Silver At Major Turning Point, Break Out To Be Violent!
On June 26, 2021
Silver Endgame Roadmap $580 by 2027 – Patrick “Badcharts” Karim Explains
On June 17, 2021
Talking with uranium superstar Justin Huhn!
On June 12, 2021
Patrick Karim & Lawrence Lepard: Gold Manipulation Will Fail and Prices Will Explode
On June 9, 2021
The Charts Are Bullish For Gold and Silver
On June 4, 2021
Live talk with Justin about crypto, gold/silver and more
On June 2, 2021
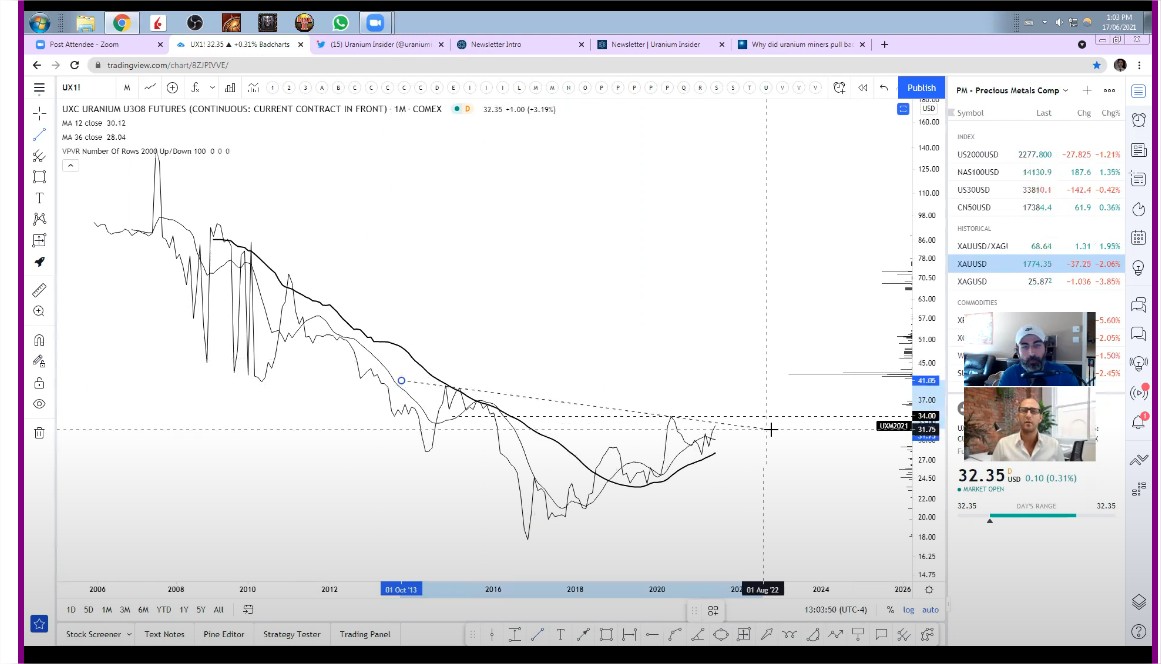
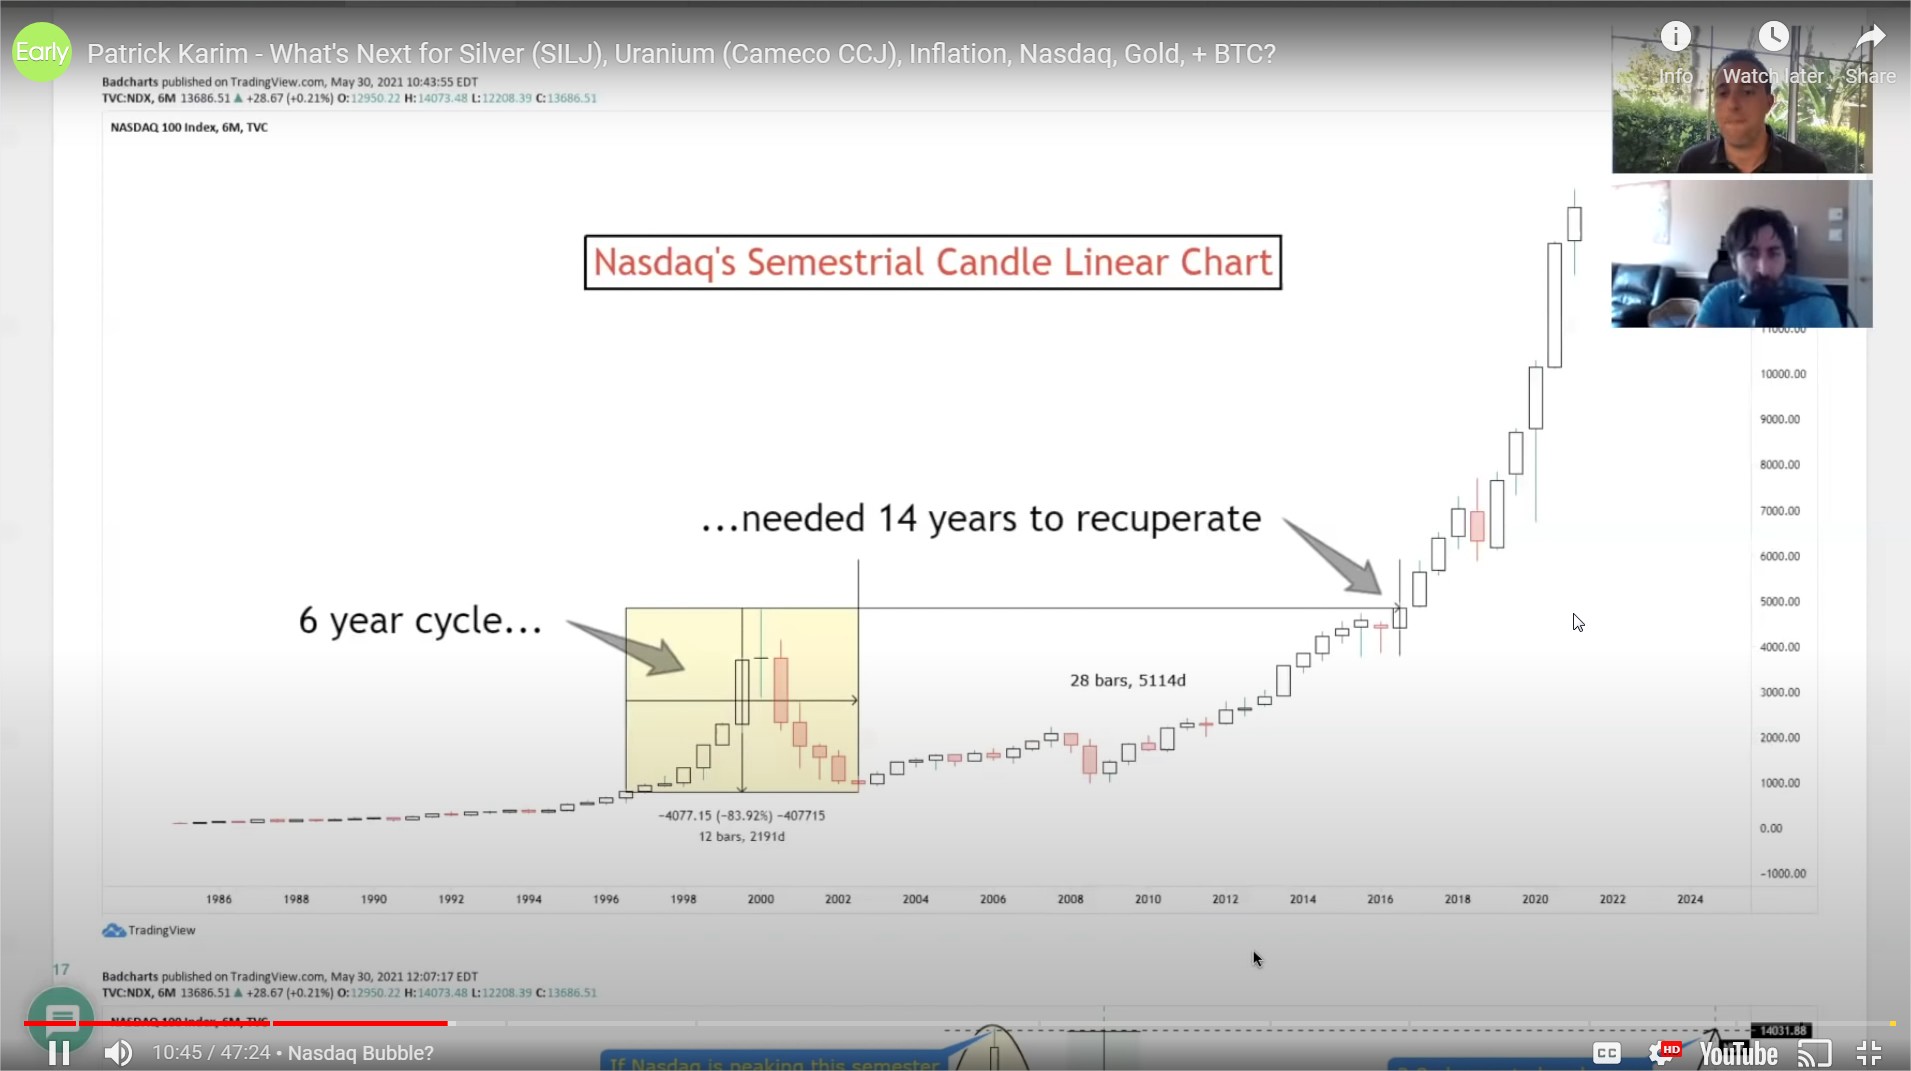
What’s Next for Silver (SILJ), Uranium (Cameco CCJ), Inflation, Nasdaq, Gold, + BTC?
On May 25, 2021
A June Monthly Close Above $29 For Silver Signals Imminent Breakout
On May 20, 2021
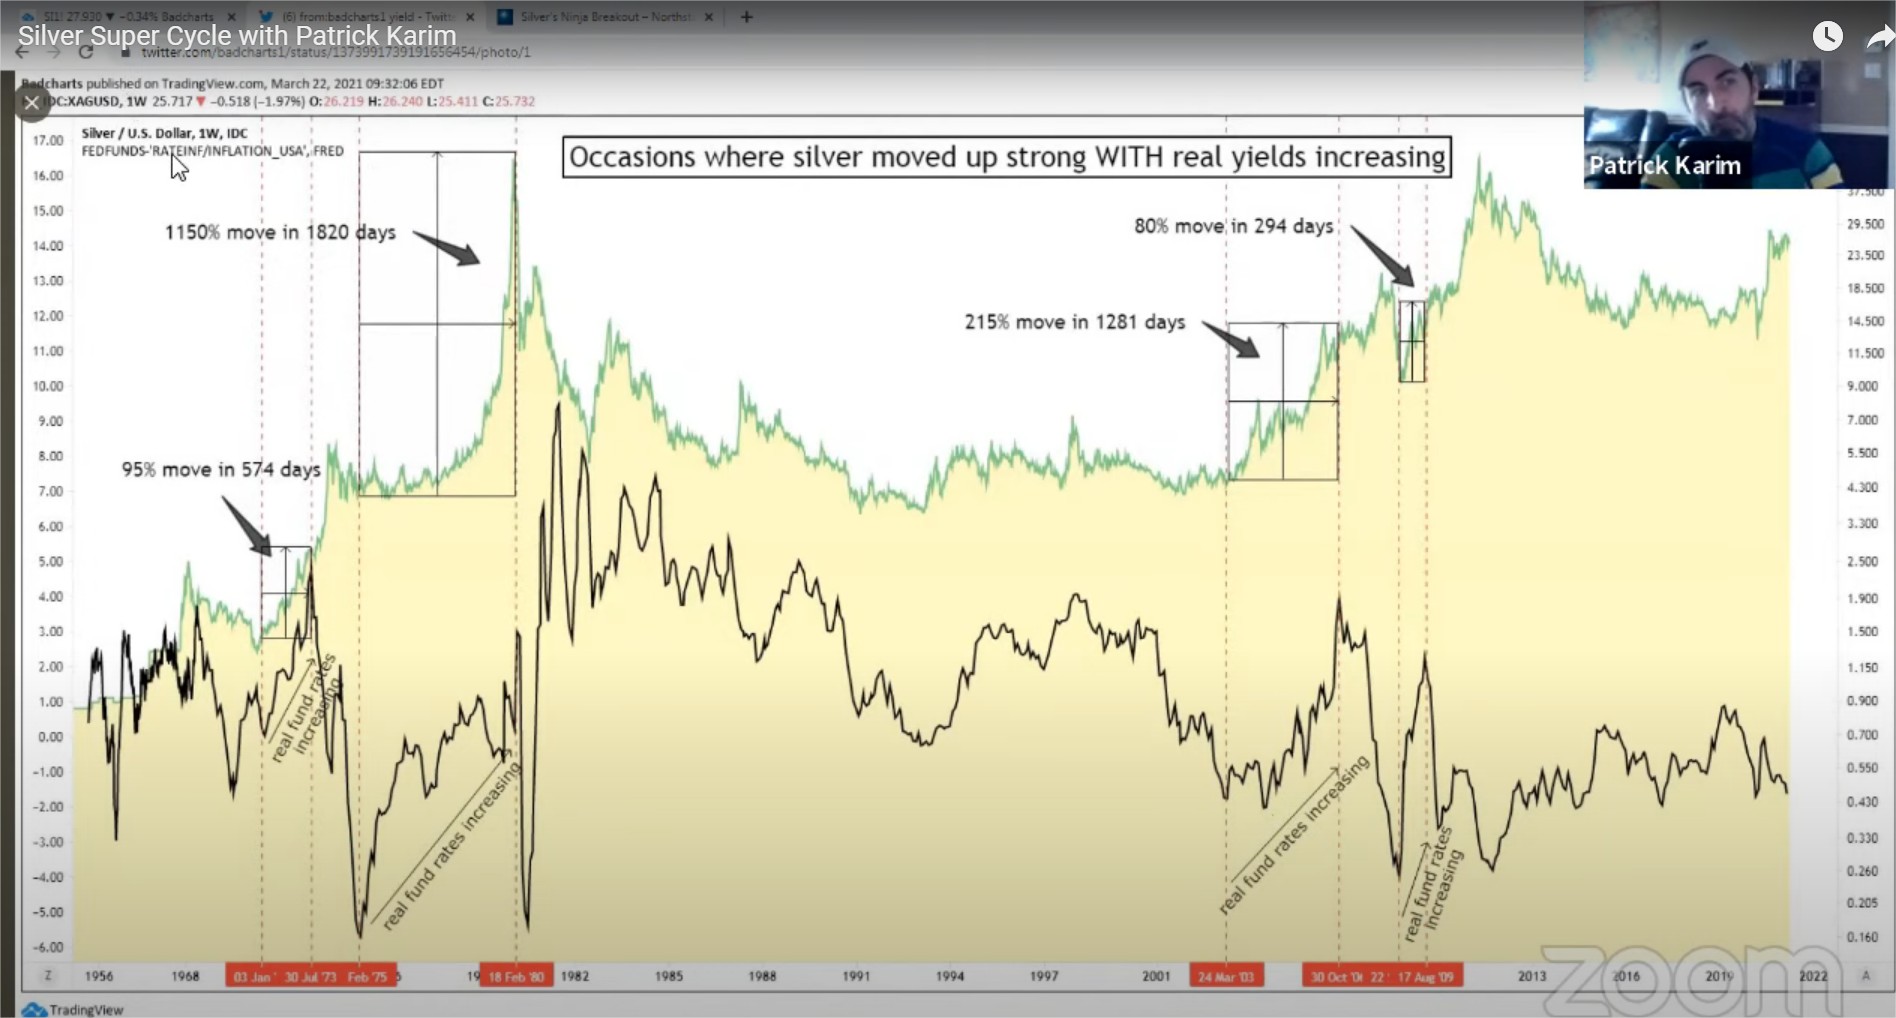
Silver Super Cycle with Patrick Karim
On May 8, 2021
Kevin Wadsworth and Patrick Karim: Gold and Silver – Technical Break Outs just Starting
On May 7, 2021
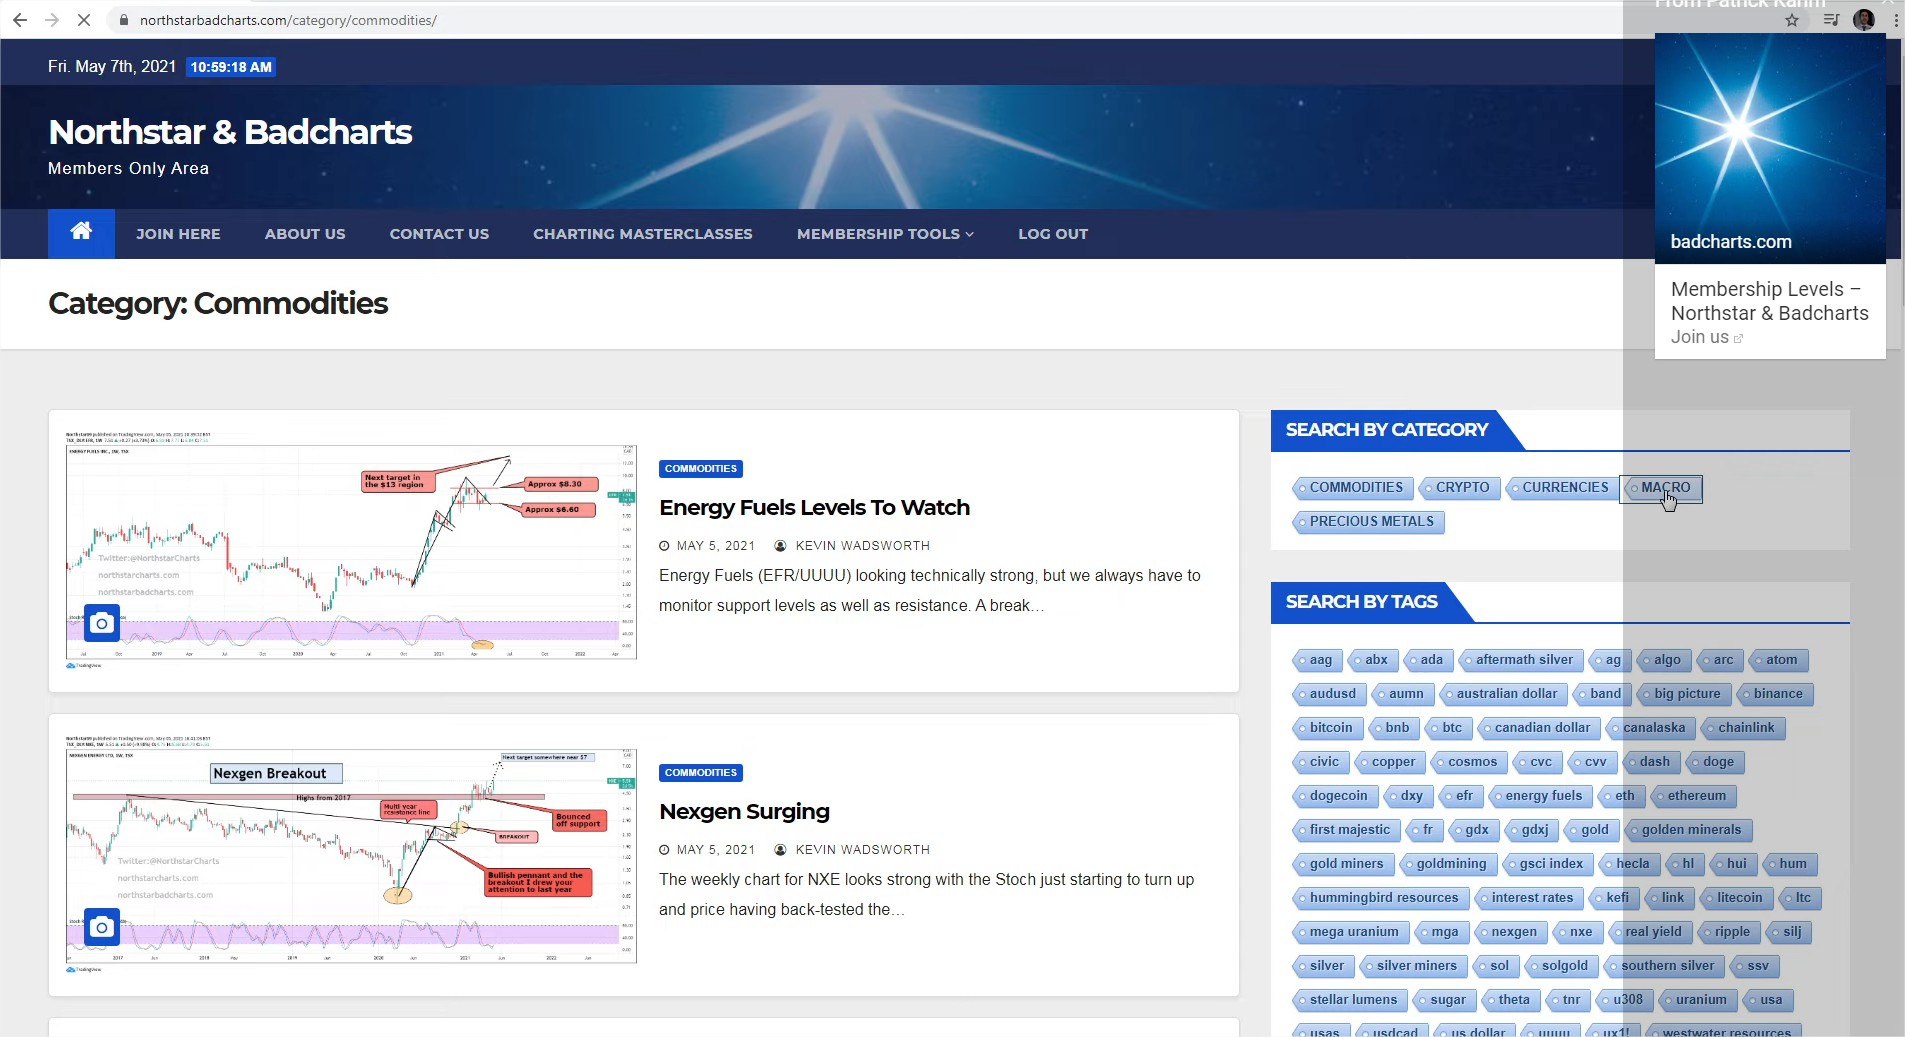
How to navigate NorthstarBadcharts.com!
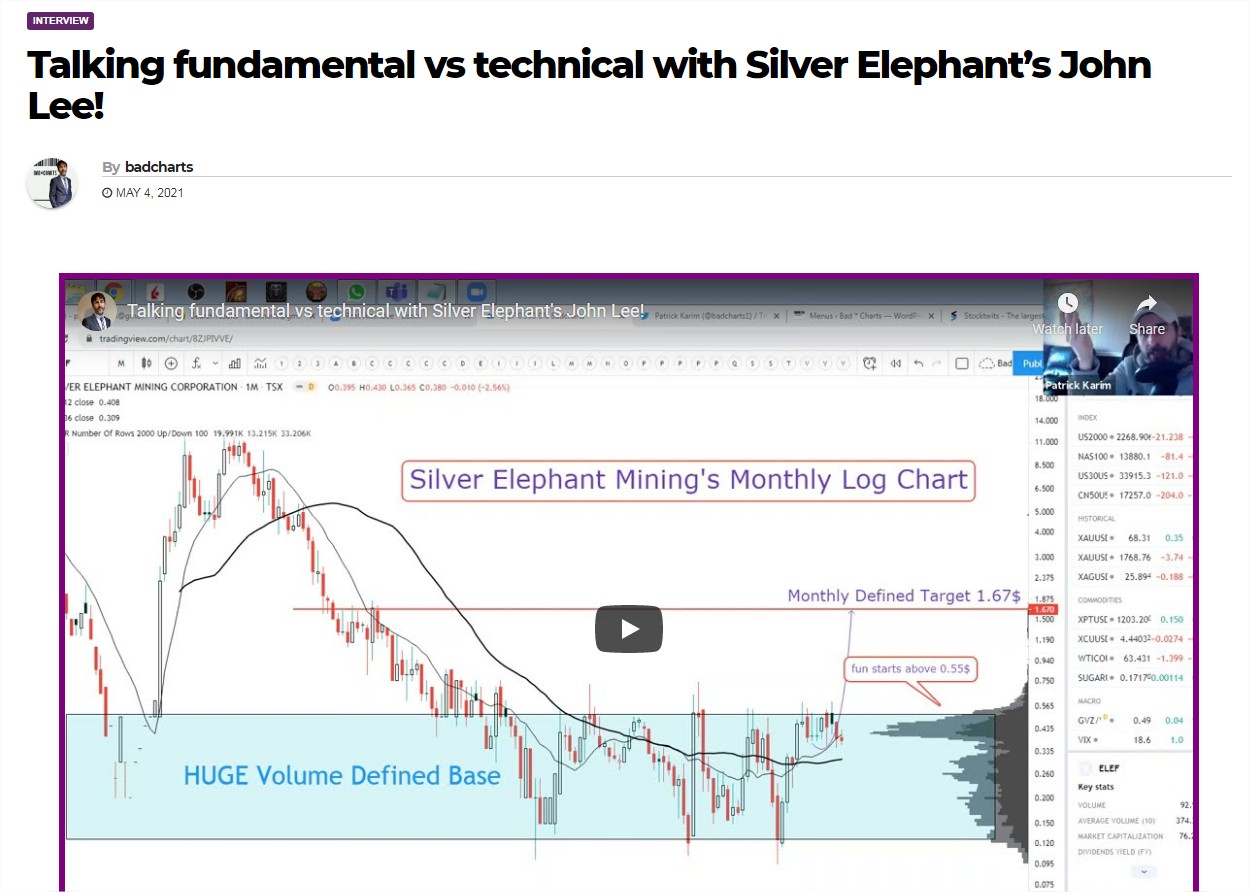
On May 4, 2021
Talking fundamental vs technical with Silver Elephant’s John Lee!
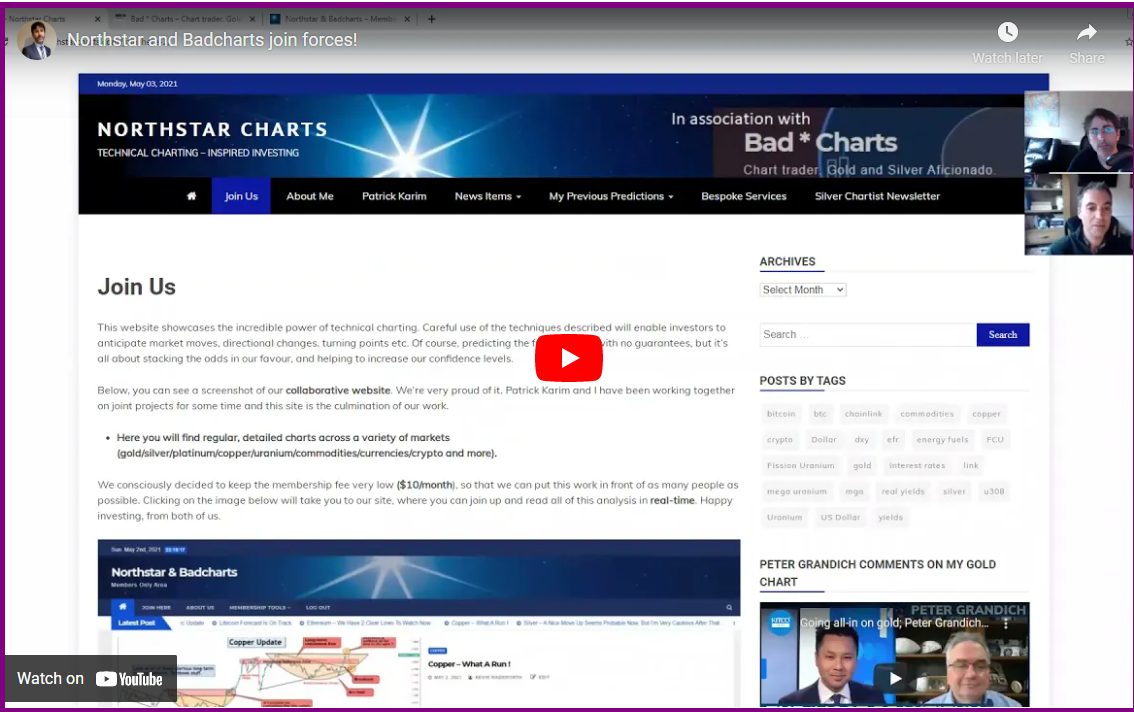
On May 3, 2021
Northstar and Badcharts join forces!
On April 29, 2021
Dollar Illusion & Gold’s Real Value
On April 25, 2021
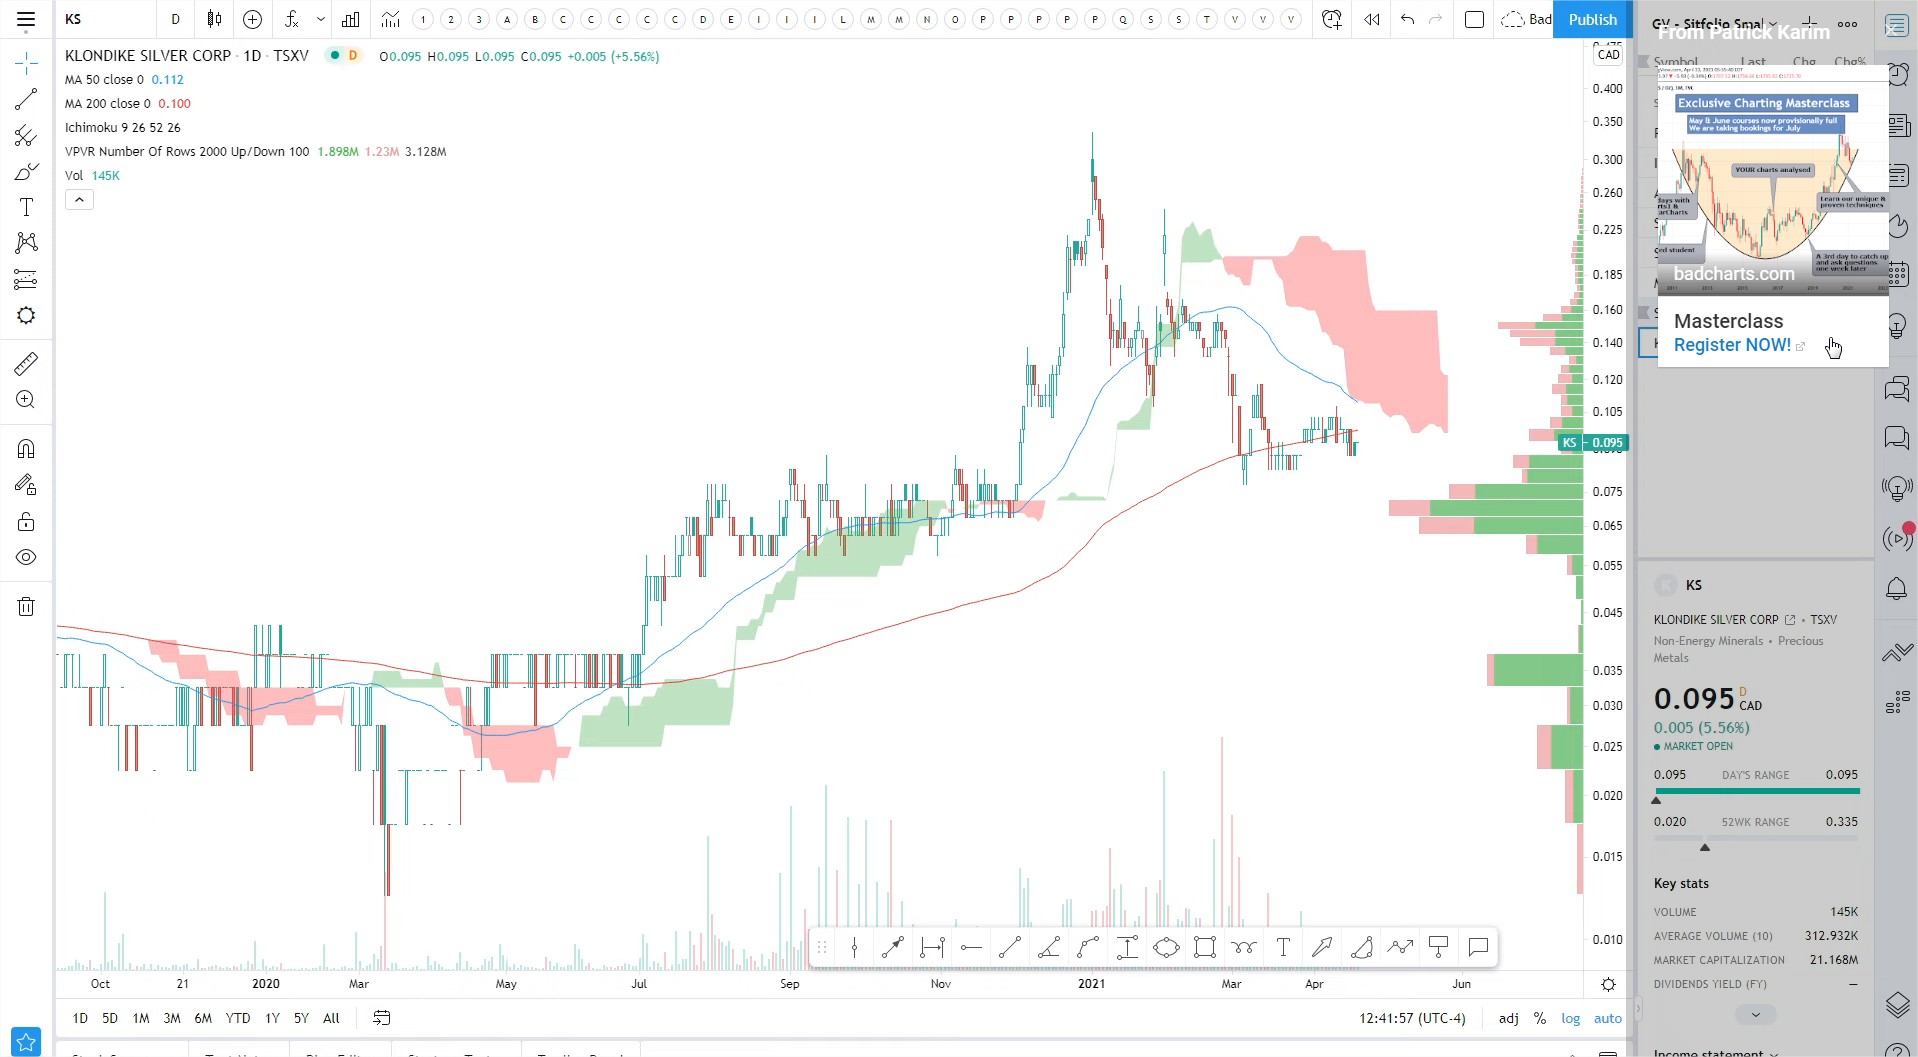
Episode 3 Part 3: Gold Ventures’ Silver Sitfolio Review
On April 21, 2021
Episode 3 Part 2: Gold Ventures’ Silver Sitfolio Review
On April 20, 2021
Episode 3 Part 1: Gold Ventures’ Silver Sitfolio Review
On April 17, 2021
Top Experts Talk Gold/Silver | Andy Schectman, Gary Wagner, Craig Hemke, & more!
On April 4, 2021
Wall Street Silver
On March 15, 2021
New Highs In Silver Within Months
On March 9, 2021
KEVIN WADSWORTH AND PATRICK KARIM: THE FIAT ENDGAME, $6,000 GOLD AND $180 SILVER
On March 9, 2021
Interview #2 with SilverBullionTV
On February 26, 2021
Interview with Kai from Soar Financial
On February 22, 2021
Interview with Elijah from Miles Franklin
On February 8, 2021
Interview #6 with Palisades Gold Radio
On February 7, 2021
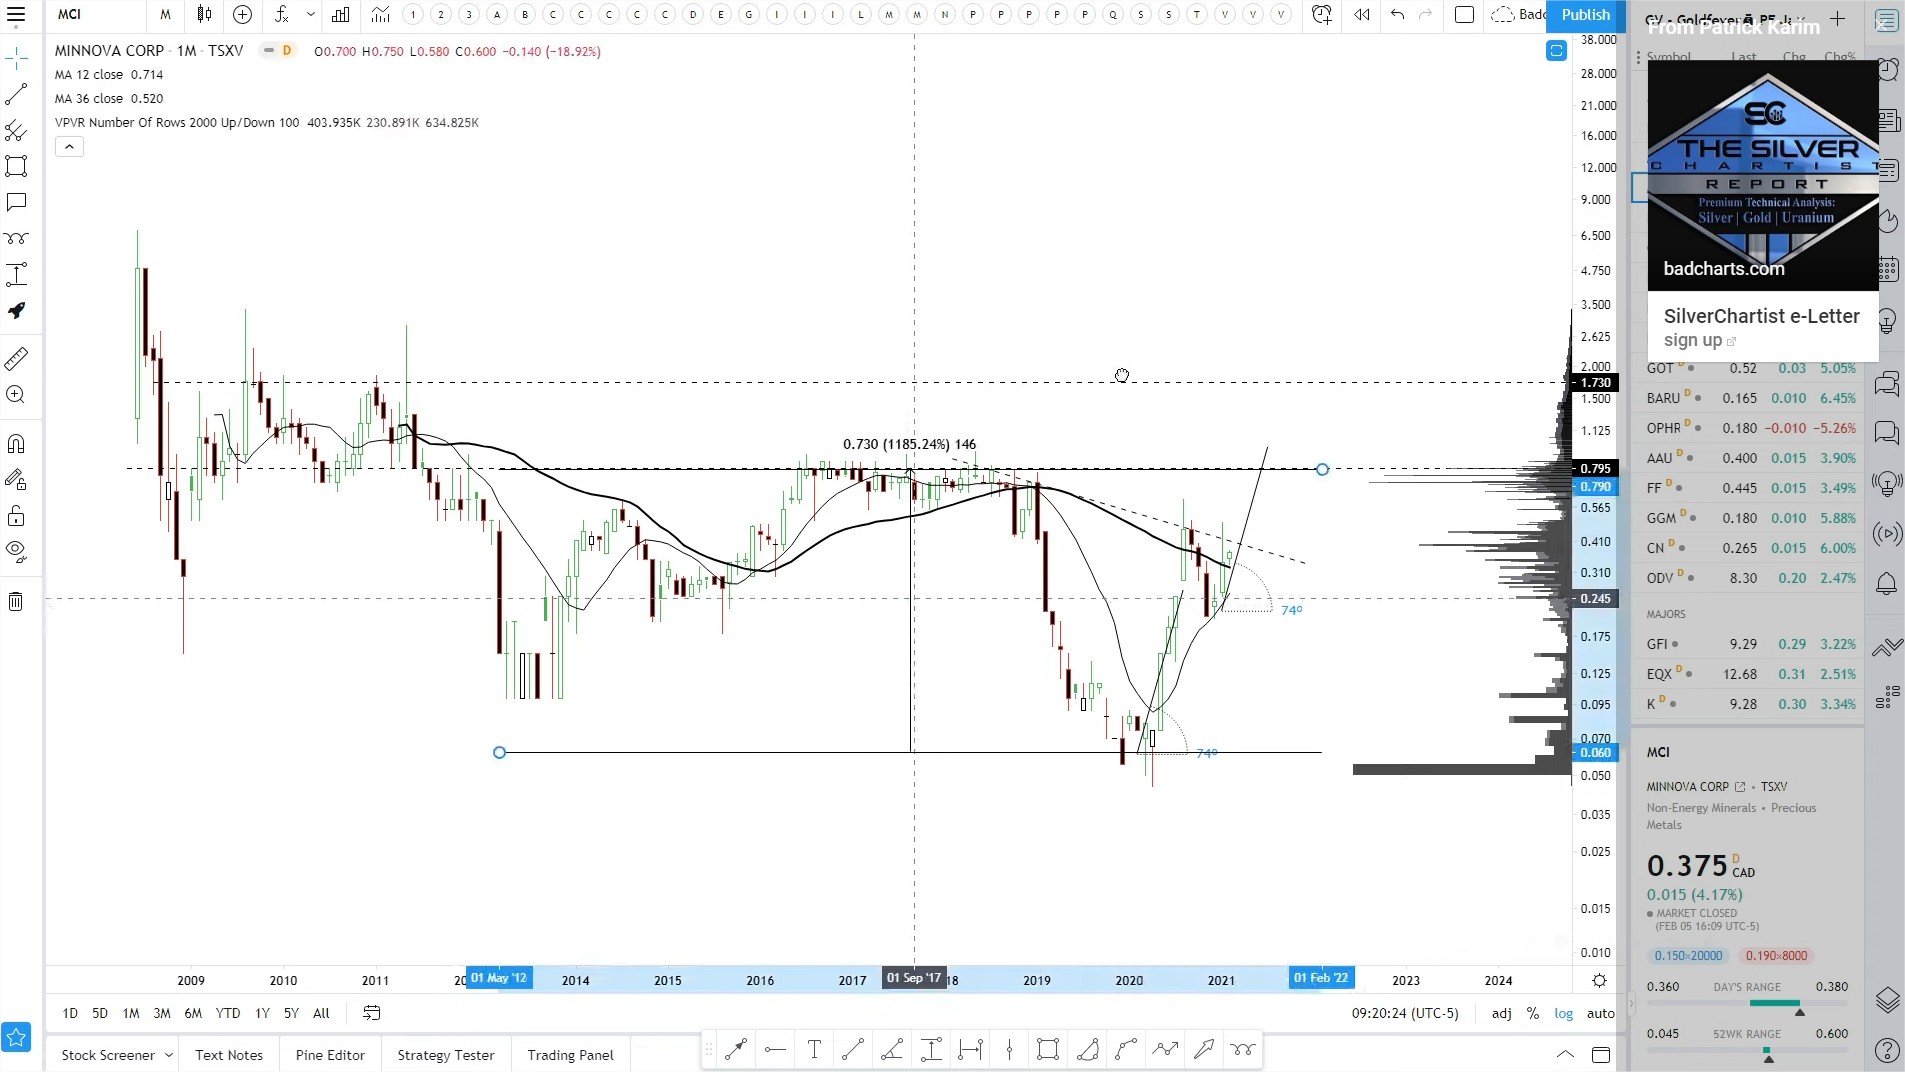
Gold Ventures’ Goldfever Portfolio Review
On February 5, 2021
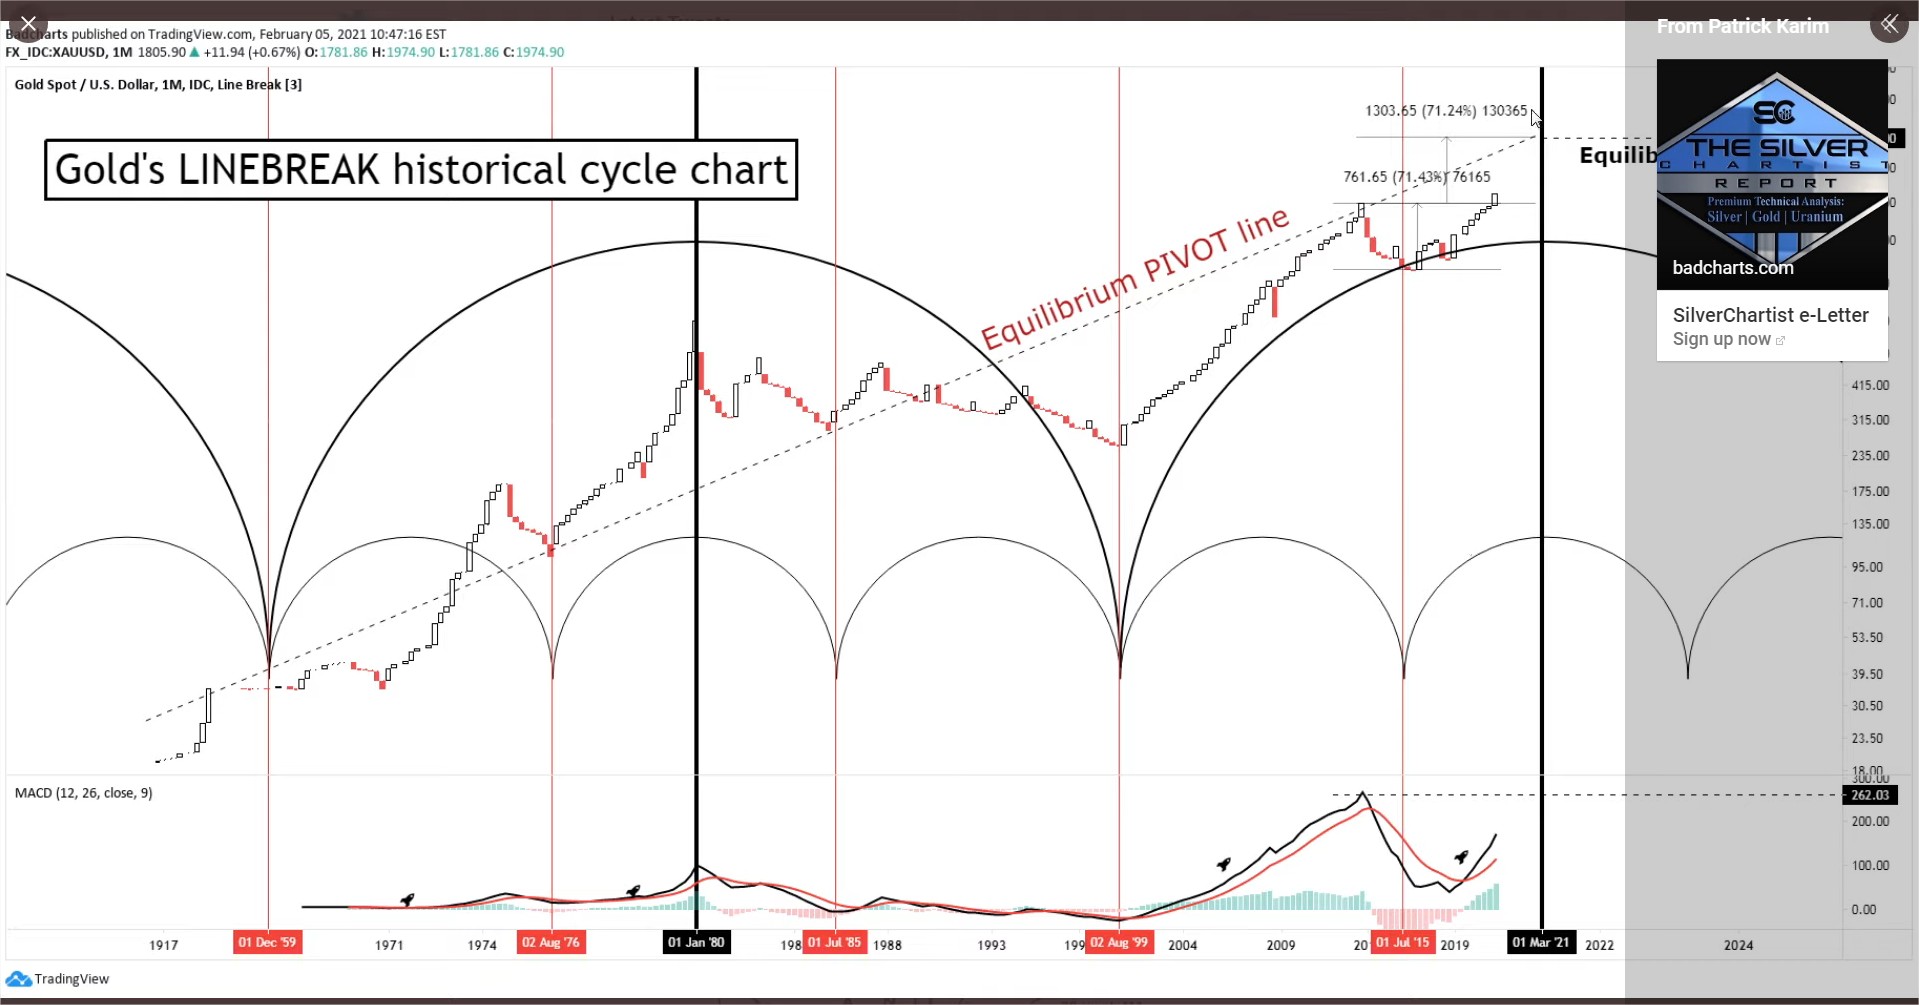
Gold’s Legendary run is happening NOW!
On February 1, 2021
#silversqueeze
On January 31, 2021
How to get 100 year Fed Fund Rates on TradingView!
On January 26, 2021
Interview with SilverBullionTV
On January 22, 2021
Steve Penny’s Uranium Miners PF Review
On January 21, 2021
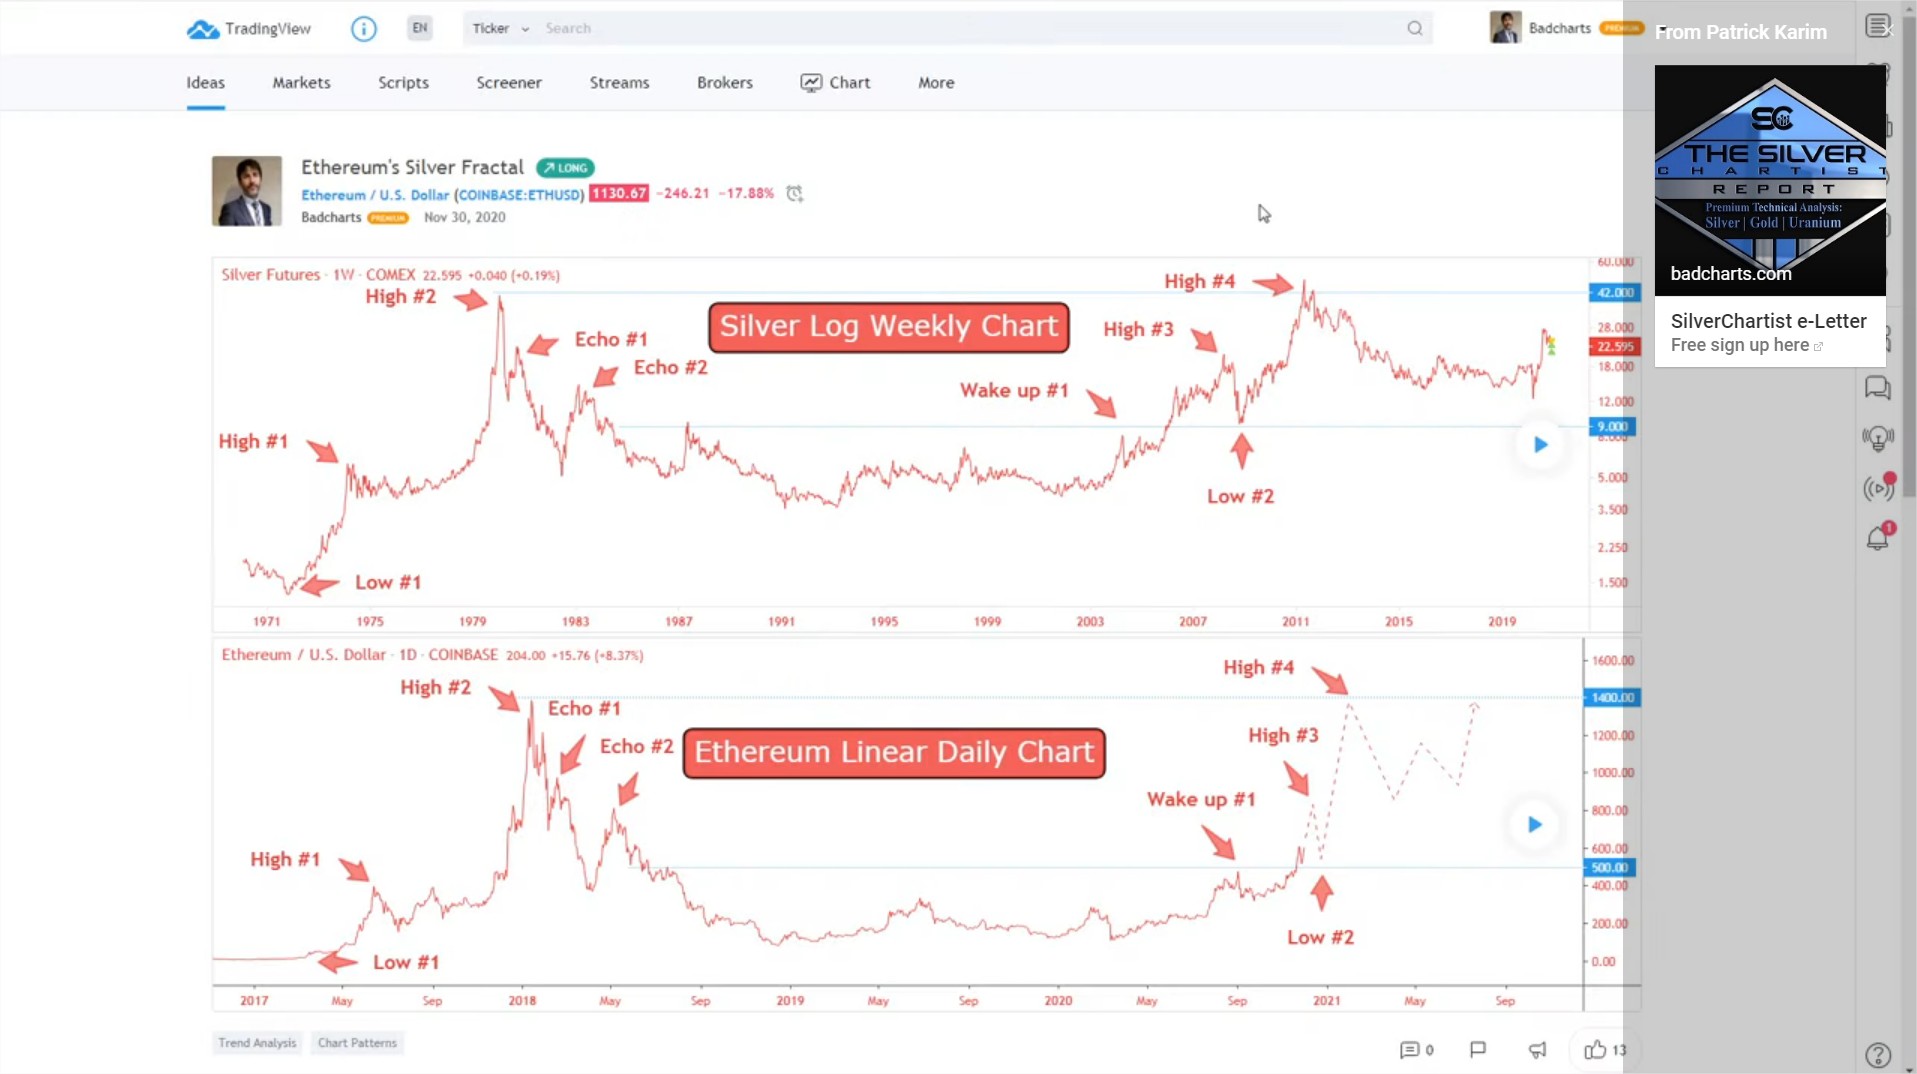
Watch in amazement Ethereum vs Silver’s Fractal!
On January 17, 2021
Episode 2: Gold Ventures’ Silver Sitfolio Review
On January 15, 2021
Silver’s Hecla, Coeur Mining, Fortuna and First Majestic Reviewed!
On December 22, 2020
Live with Garrett Goggin
On December 21, 2020
Interview with Eliot from The Early Stage Investor
On December 20, 2020
Reviewing my charting skills… Silver and Gold included!
On December 12, 2020
Gold Ventures’ Silver Sitfolio Review
On December 3, 2020
Interview #2 with Dale Pinkert
On November 29, 2020
Don Durrett’s latest top 10 gold and silver stocks!
On November 20, 2020
End of Gold and Silver Bull Markets?
On November 15, 2020
Black Friday TradingView Offer
On November 13, 2020
Interview #5 with Palisades Gold Radio
On November 11, 2020
Gold and Silver Ratio’s “Multiple Time Frame Analysis”
On November 7, 2020
Reviewing YOUR gold and silver stocks!
On October 30, 2020
Northstar’s “Gold and US Elections”
On October 28, 2020
Memory versus Reality
On October 27, 2020
US Dollar still looks weak…
On October 19, 2020
Interview with Dale Pinkert
On October 17, 2020
Don Durrett’s Top 25 Gold and Silver Stocks!
On October 14, 2020
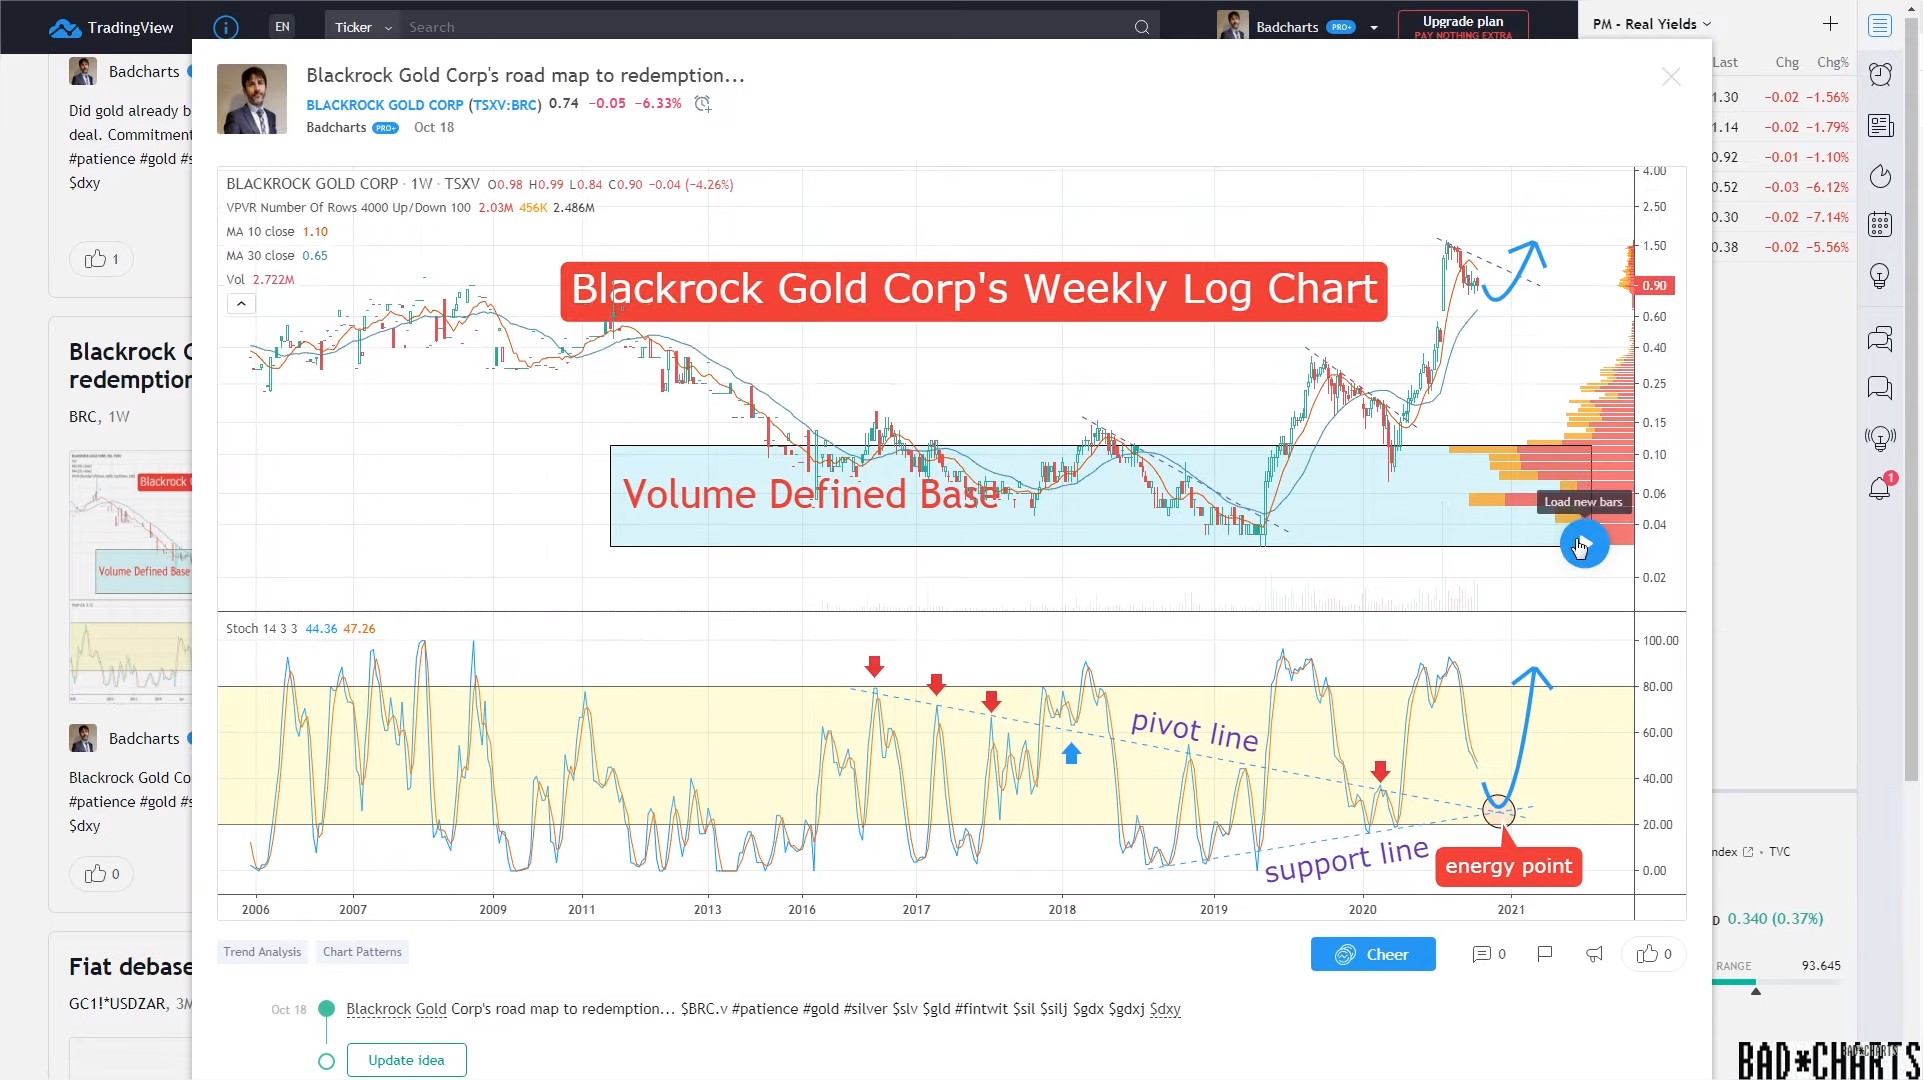
Fiat debasement WILL never stop!
On October 14, 2020
My Chinese Crystal Ball…
On October 14, 2020
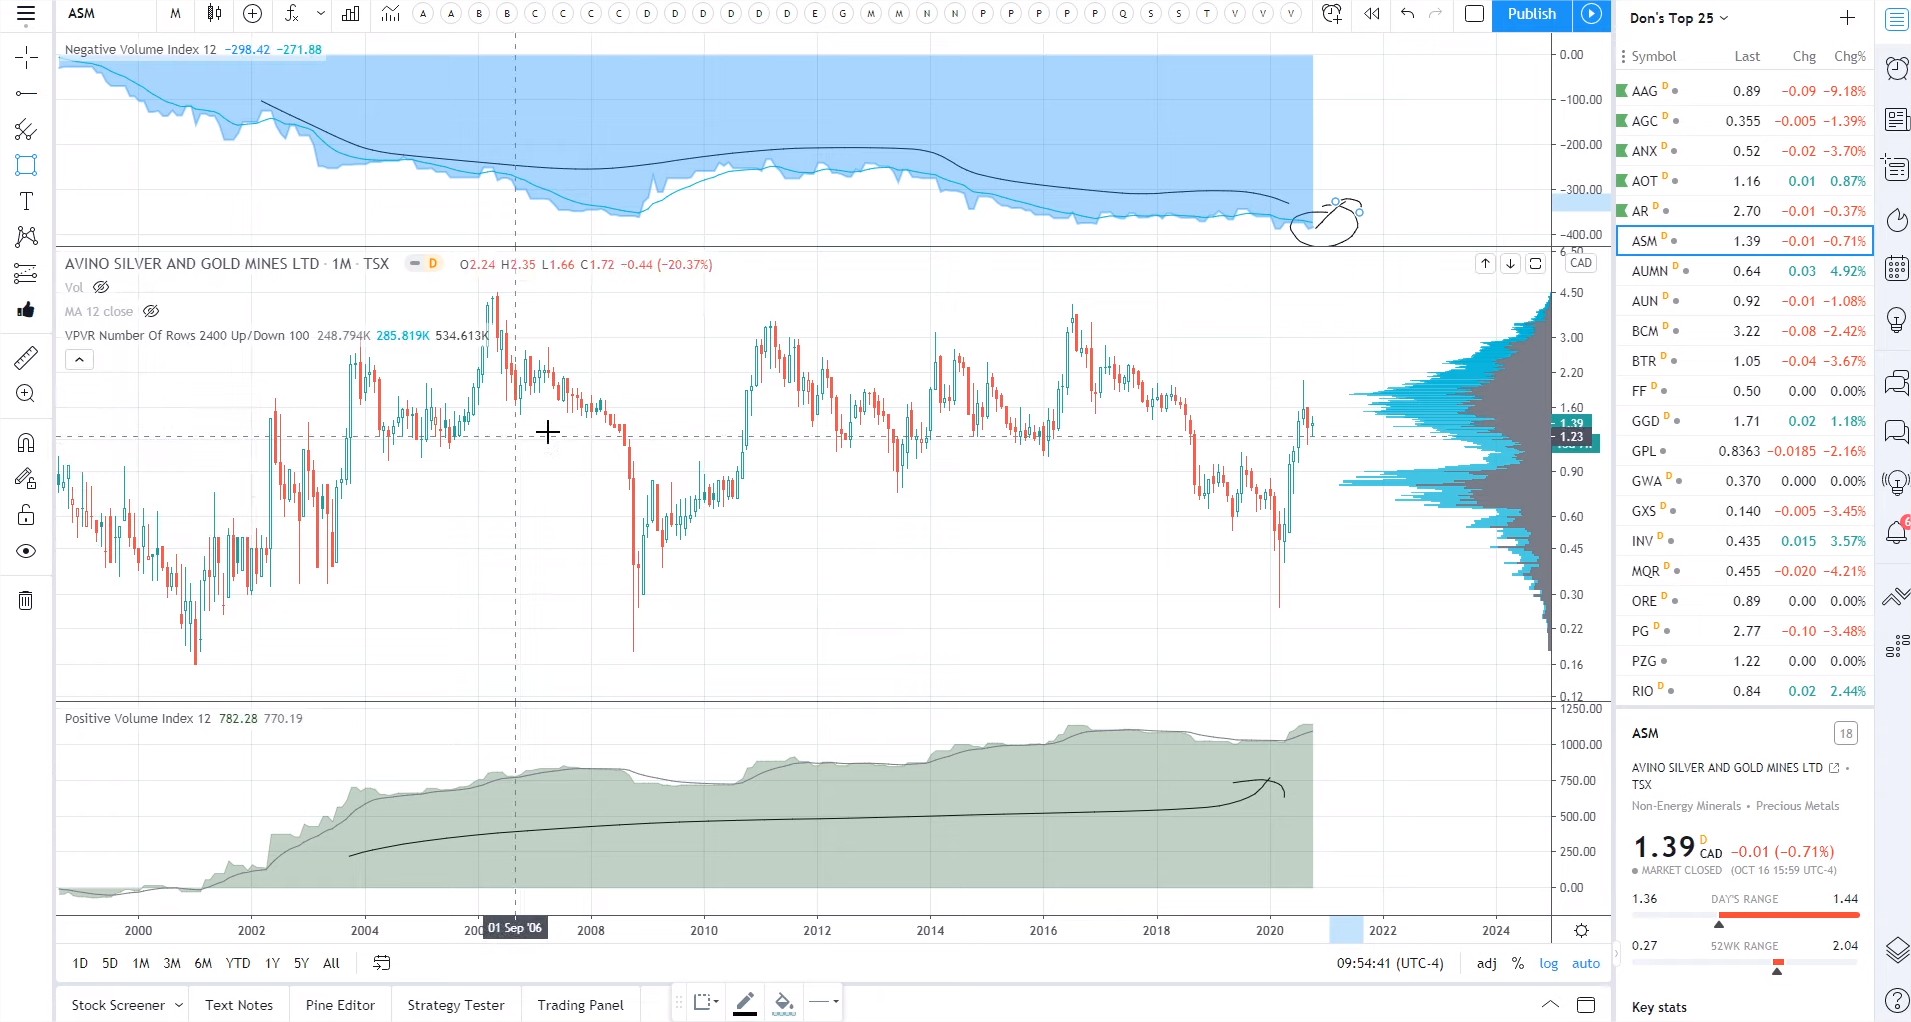
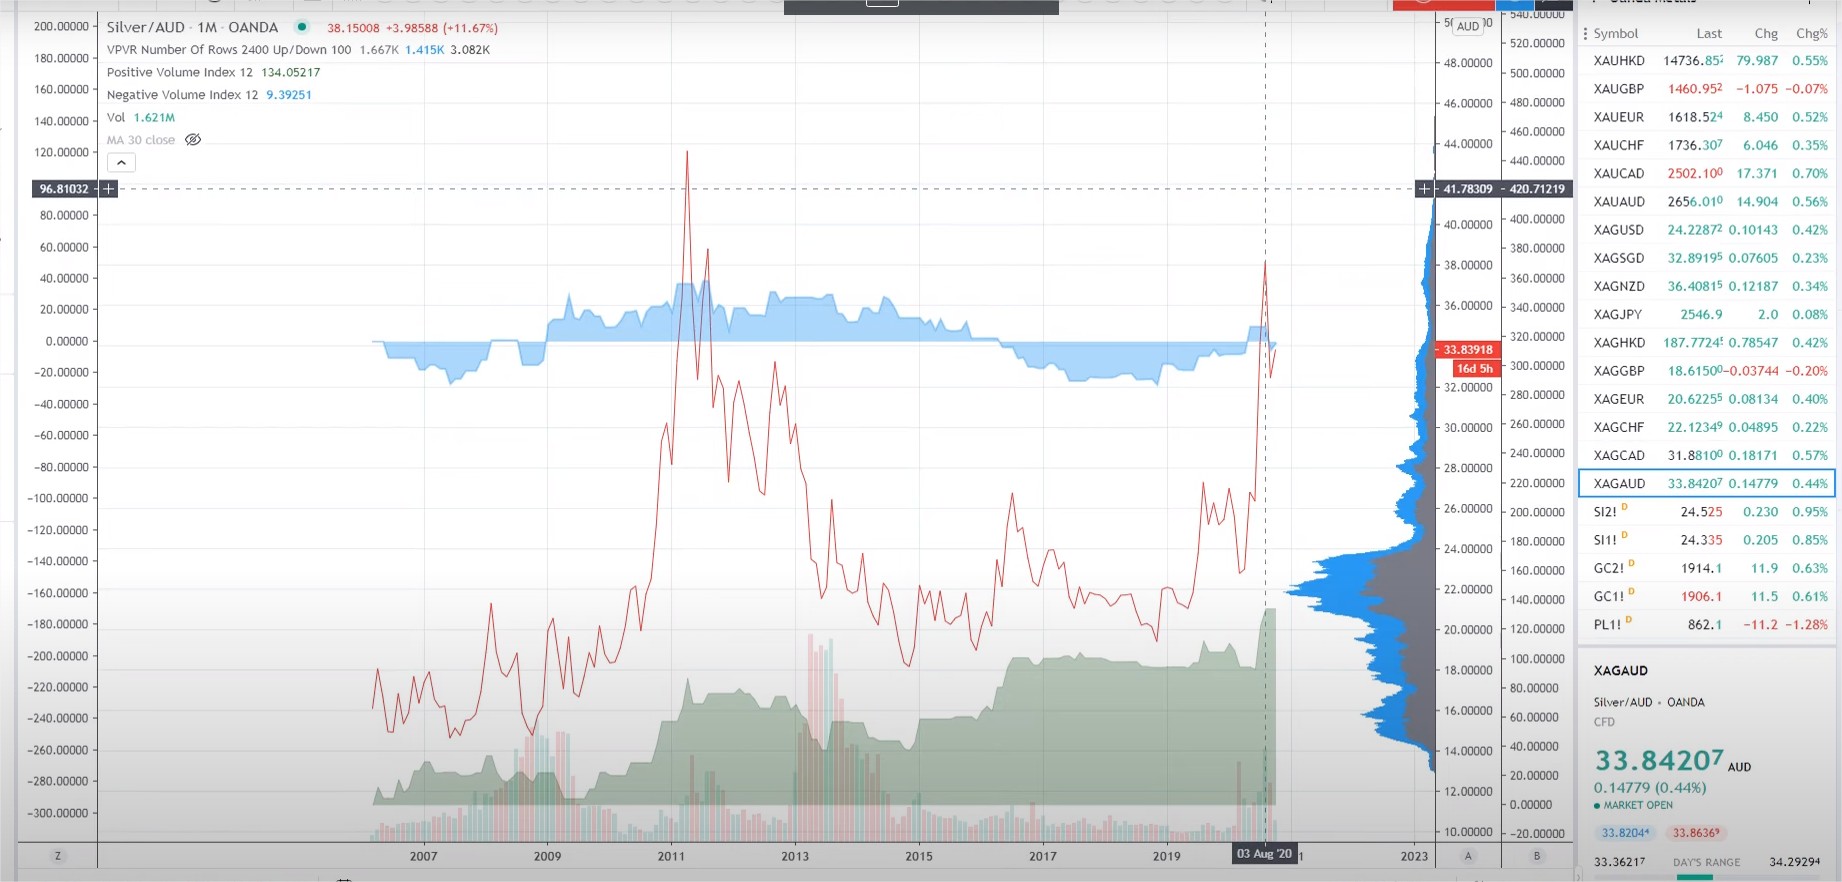
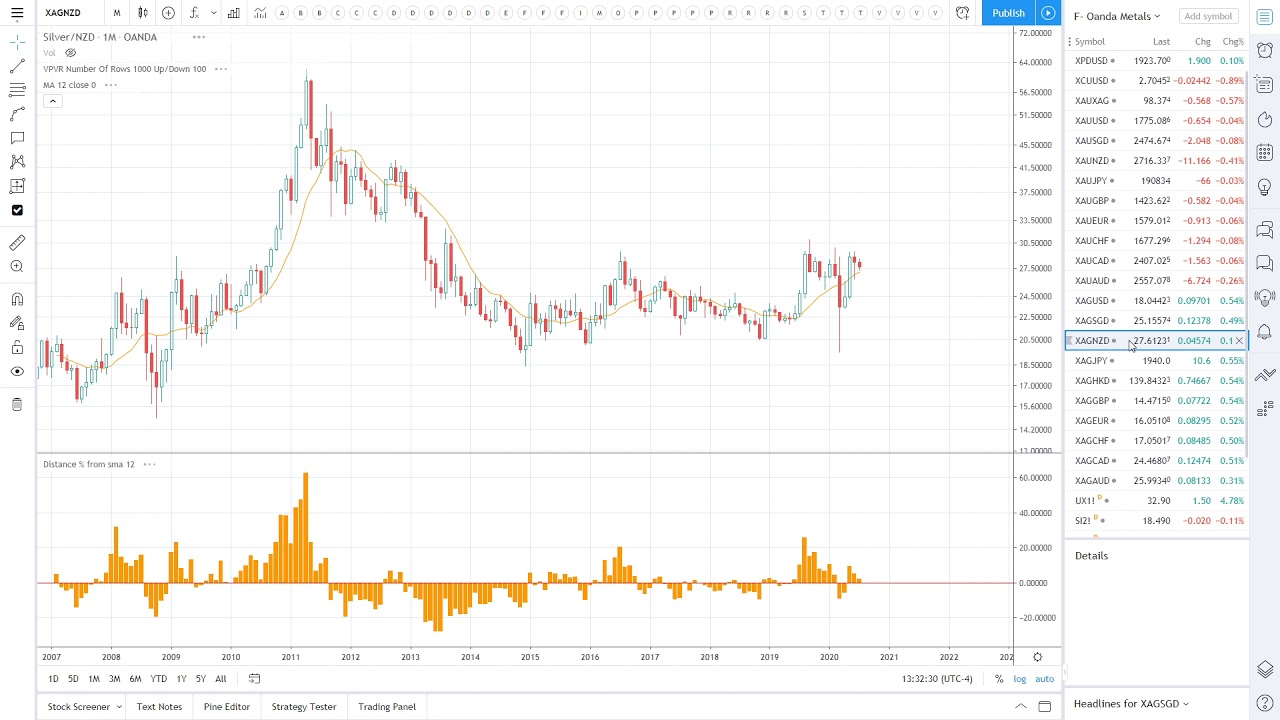
Silver’s Multi Currency Review
On October 3, 2020
Gold and Silver’s “Big Picture” with Northstar!
On September 17, 2020
Interview #4 with Chris Vermeulen and Palisade Radio
On September 7, 2020
Don Durrett’s Top 10 Gold Stocks!
On September 6, 2020
Northstar looking for 10x Gold & Silver Stocks!
On August 29, 2020
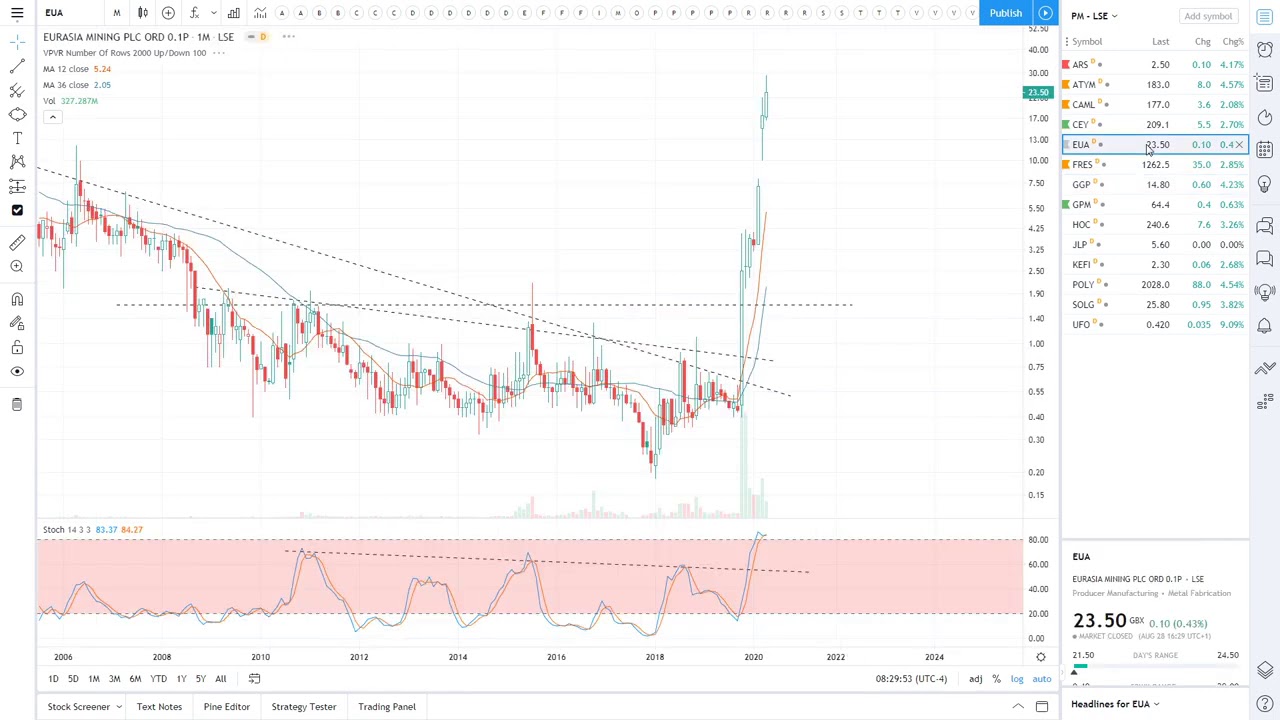
Top 5 London Stock Exchange Gold/Silver Stocks!
On August 26, 2020
Talking with Northstar about Metals… So much fun!
On August 24, 2020
Nineteen Eric Sprott Holdings about to Detonate!
On August 23, 2020
Eight Explosive Silver Stock Setups!
On August 22, 2020
Blitz Review of MANY Gold/Silver Stocks!
On August 21, 2020
Interview #3 with Palisade Radio
On August 13, 2020
LIVE Stream: Northstar joining Bad*Charts once again!
On August 11, 2020
LIVE Stream: Gold And Silver CORRECTING!
On August 10, 2020
Badcharts 1st Live Stream
On August 4, 2020
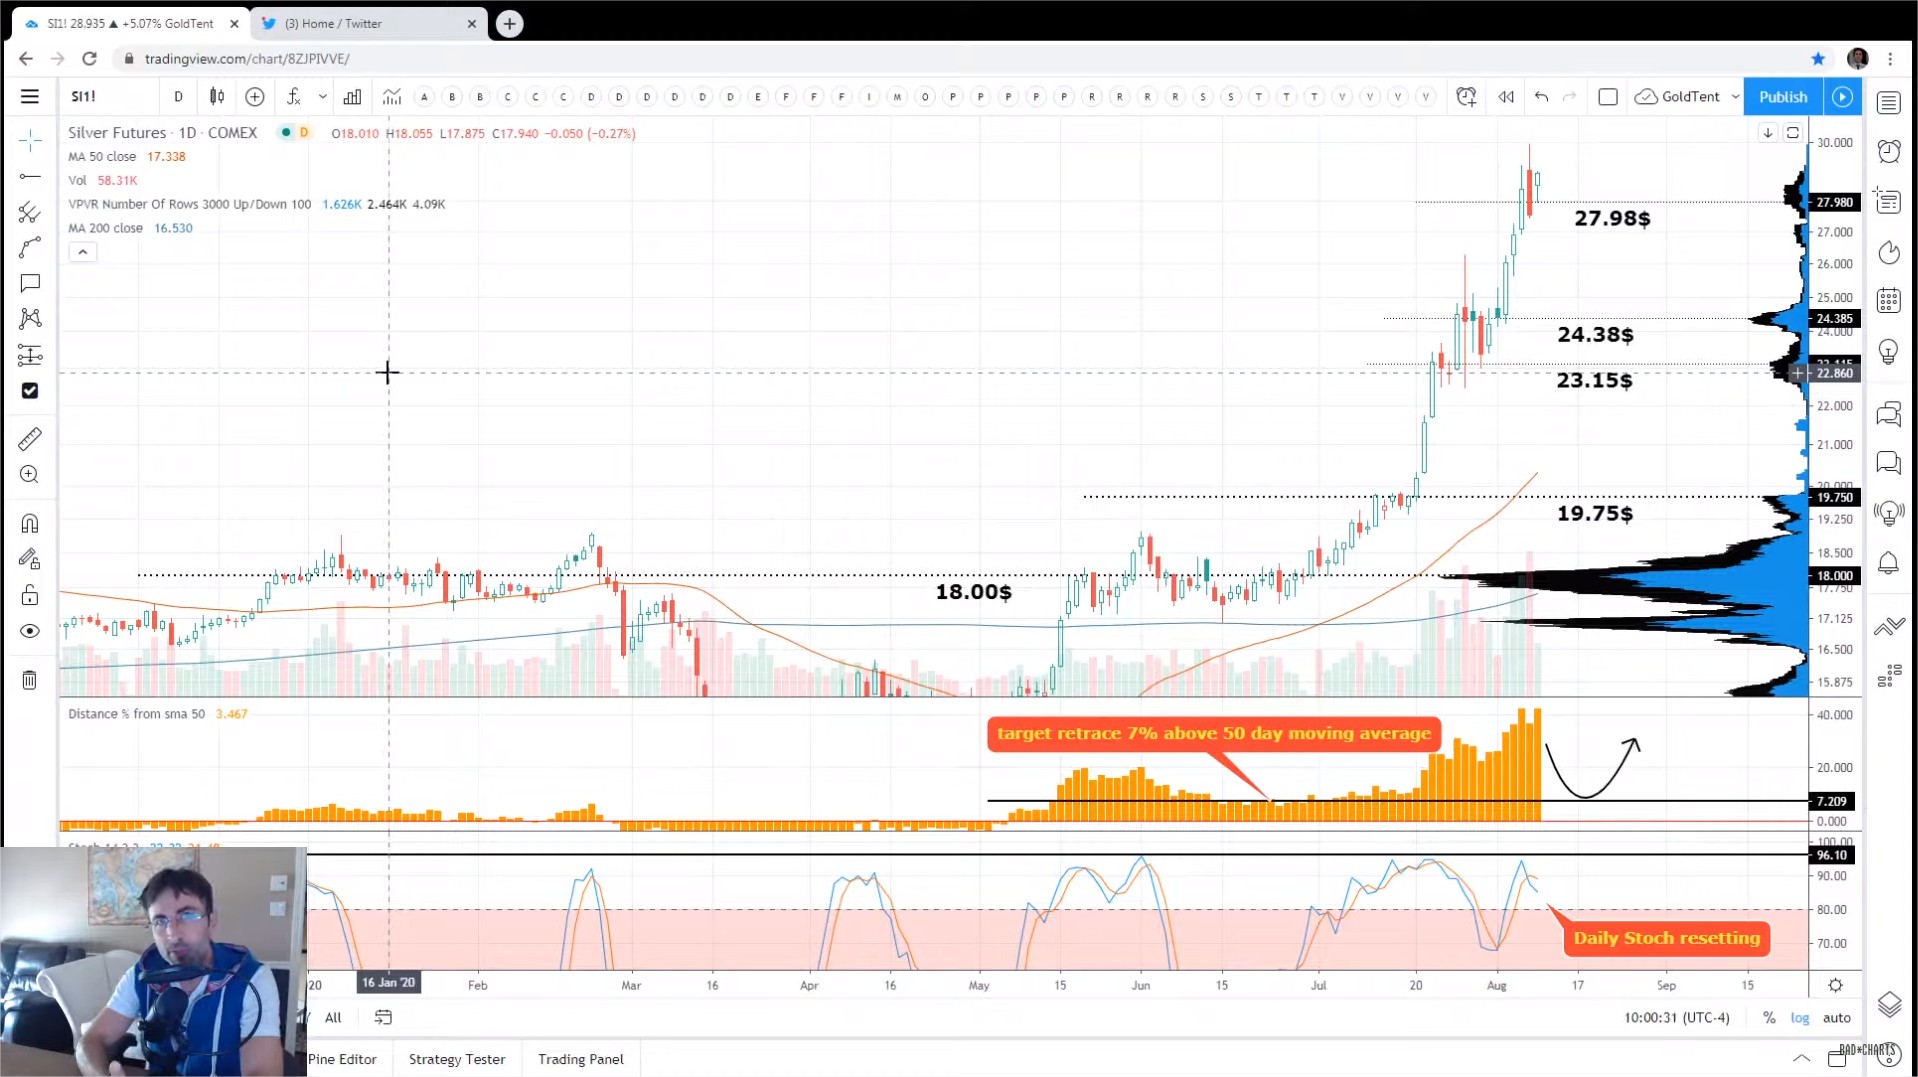
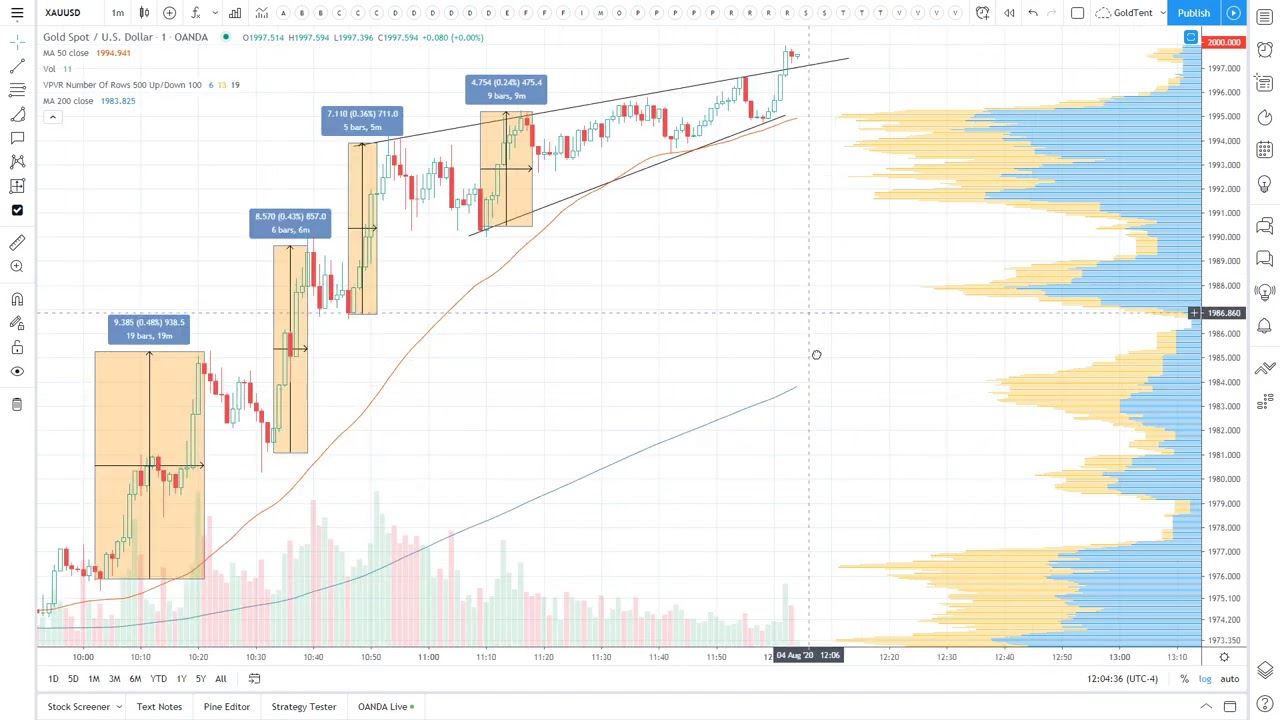
Spot Gold BREAKS 2000$ !!!
On August 3, 2020
Northstar’s Secrets For Profiting in Gold/Silver & Bitcoin Revealed!
On July 31, 2020
Live Chat with Garrett Goggin
On July 27, 2020
Interview with Lior Gantz
On July 18, 2020
Explosive Summer for Gold and Silver!
On July 10, 2020
Interview #2 with Palisade Radio
On July 4, 2020
Silver on brink of DECISIVE move!
On July 1, 2020
Expect Summer Fireworks for Gold, Silver & Miners!
On June 20, 2020
On Deck: Next move up for Gold and Silver Bull Markets!
On June 6, 2020
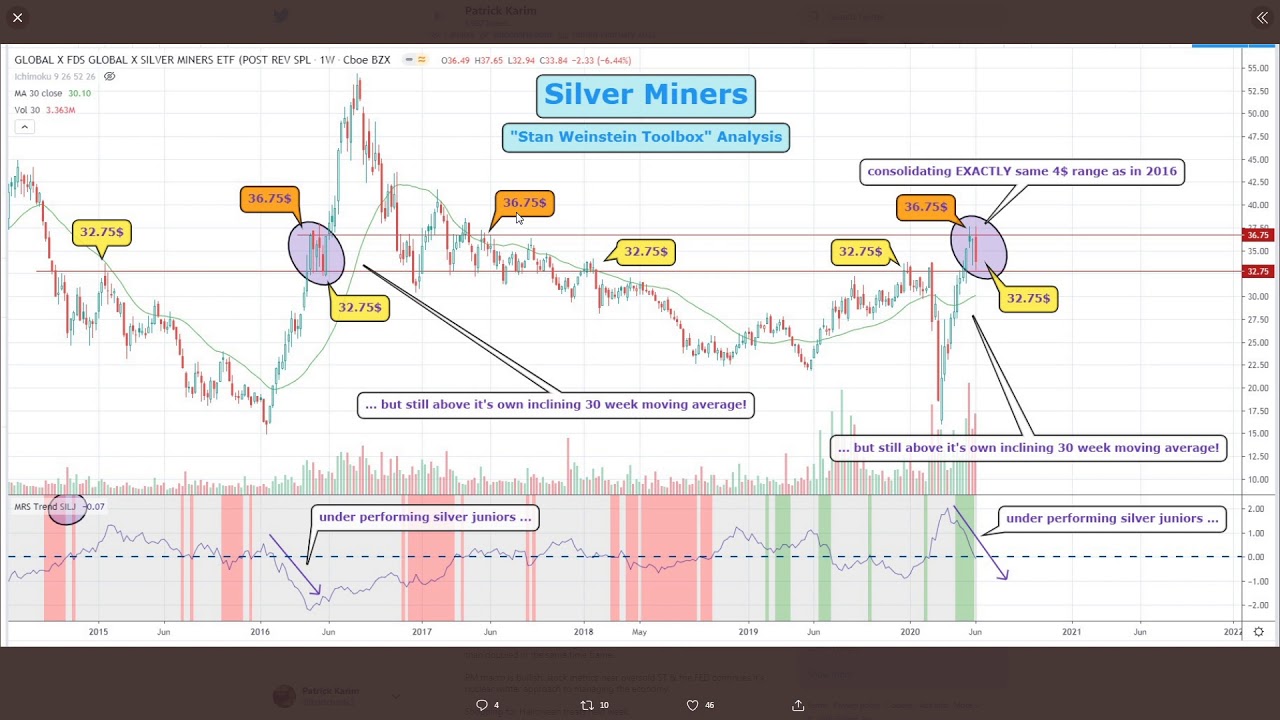
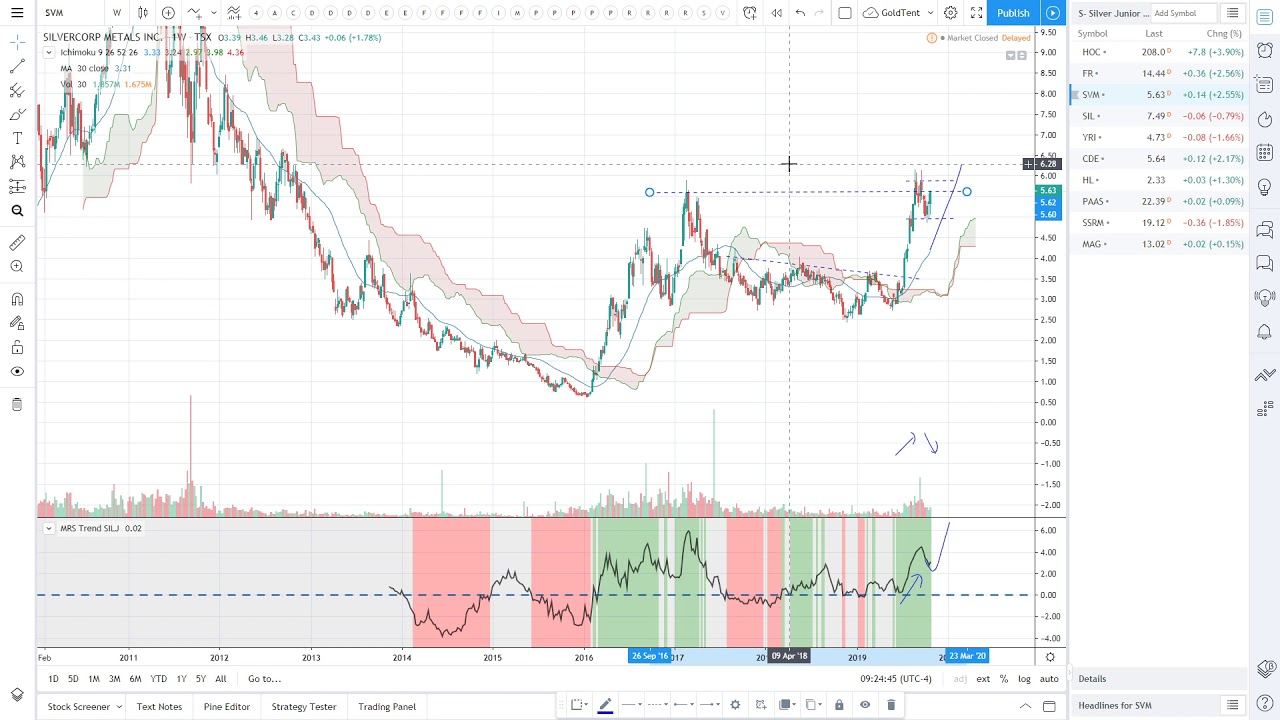
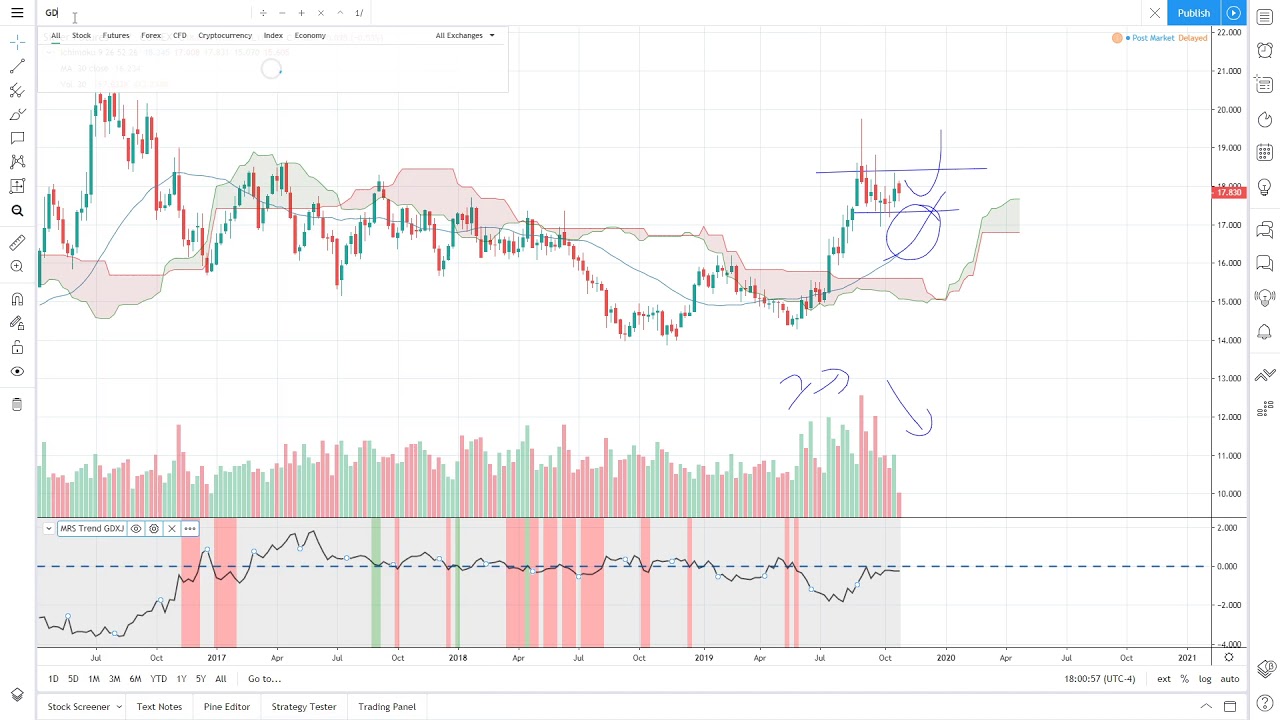
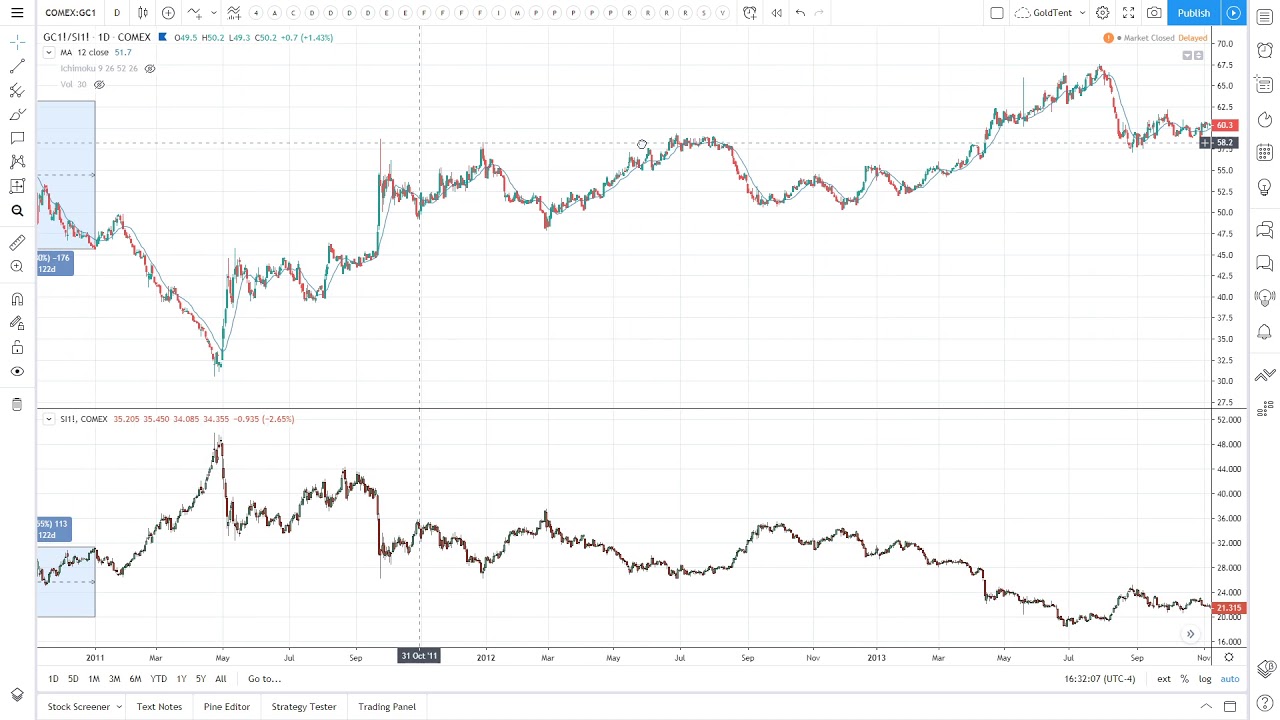
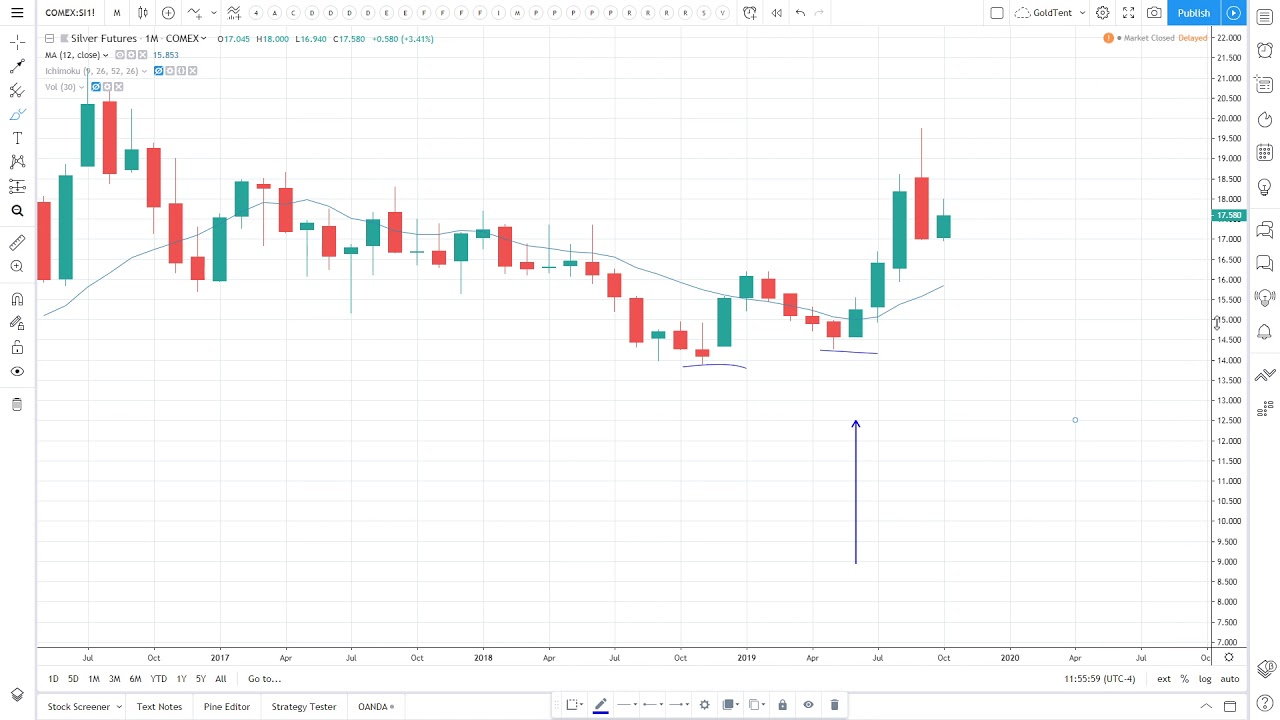
Silver Junior Miners, Silver Miners and Silver PRIMED for a fast move!
On June 4, 2020
Interview with Palisade Radio
On May 2, 2020
How to Navigate the Precious Metals Bull Market!
On April 26, 2020
How to Take Profits in a Gold Bull Market?
On April 25, 2020
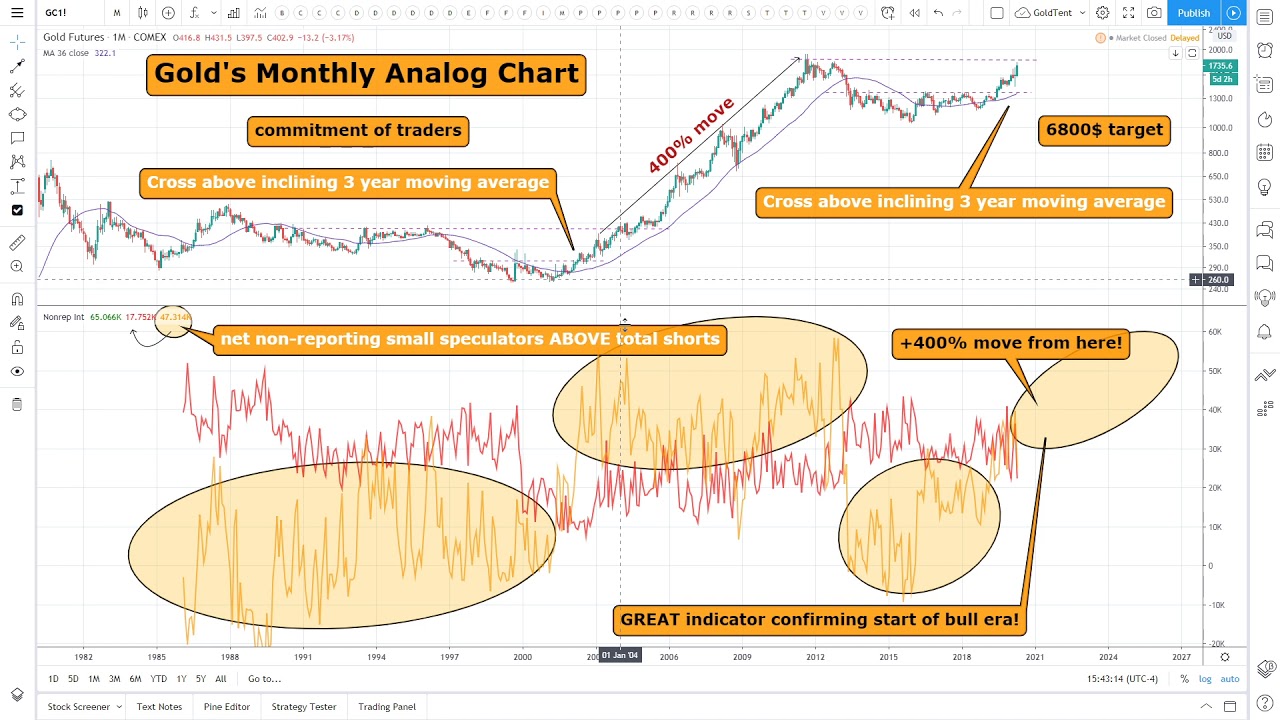
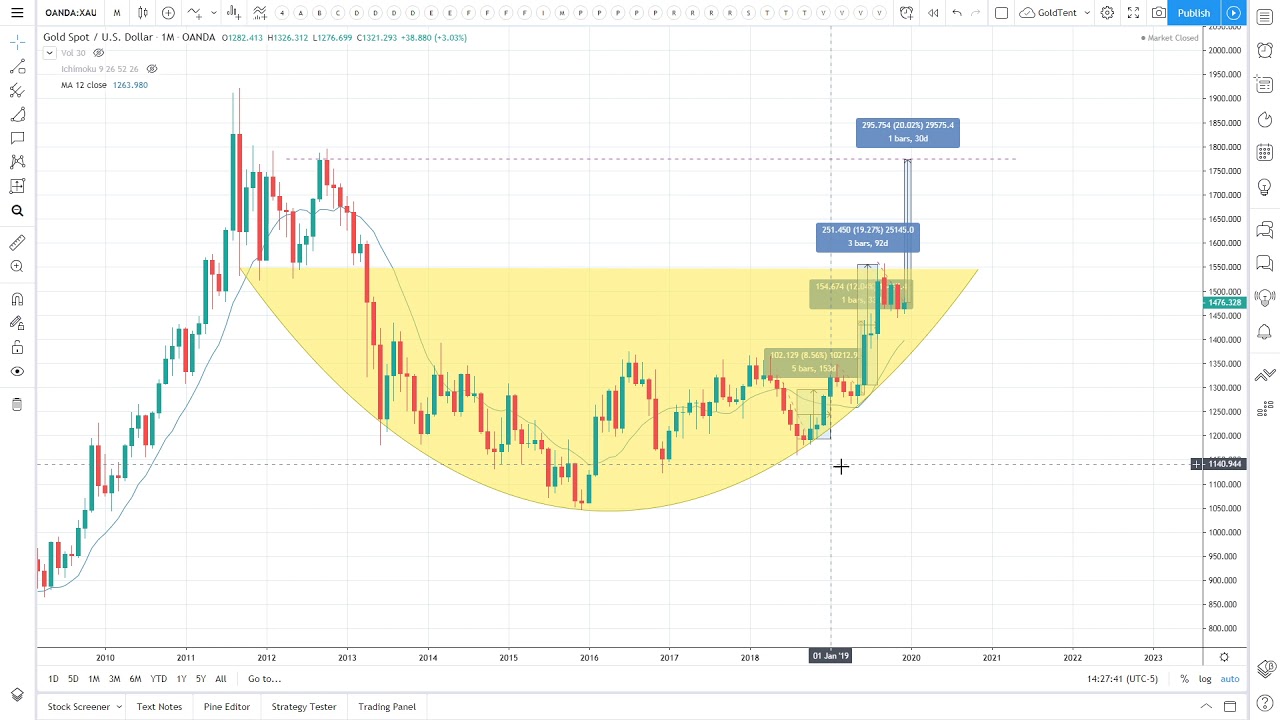
Gold’s 400% move AND 6800$ target!
On March 29, 2020
Gold Bull Market GUARANTEED by US Government!
On March 15, 2020
Has Silver Bottomed?
On February 23, 2020
How To Play “GODLIKE” Gold Bull Market
On February 12, 2020
Why Gold and Silver Bull Markets NEED inflation!
On February 1, 2020
Gold and Silver next move up has started!
On January 25, 2020
Gold and Silver Bull Market explained in 4 minutes
On January 24, 2020
Gold and Silver Miners are primed for EXPLOSION (juniors also)!
On January 17, 2020
Gold and Silver Bull Market’s 2700$ and 60$ cycle peaks!
On January 7, 2020
Melt-up ON DECK for Gold and Silver!
On December 29, 2019
Gold and Silver Bull Market will Rise as Fiats Fall
On December 21, 2019
HOW and WHY Silver Bull Market 27$
On December 14, 2019
How Gold Bull Market hits 1800$ before March 2020!
On December 1, 2019
Is Silver really a precious metal?
On November 22, 2019
Gold and Silver Bull Market FLOOD GATES are OPEN!
On November 17, 2019
NO RATE CUT actually BULLISH for Gold!
On November 8, 2019
The Gold and Silver bull run JUST started!
On November 2, 2019
Which is the BEST Silver Junior Miner play?
On October 29, 2019
400% – 800% more REWARD than Silver?!?
On October 26, 2019
Expecting 100% gains in Silver vs GSR!
On October 19, 2019
Silver has INSANE reward vs risk!
On October 14, 2019
Secretwars #0426 – Markets Review: 54$ Silver by late 2021?
On September 8, 2019
Secretwars #0425 – Markets Review: How many months before Gold pulls back?
On August 31, 2019
Secretwars #0424 – Markets Review: When will Silver reach my price target?
On June 28, 2019
Secretwars #0423 – Markets Review: Gold, US Dollar, Yields and more!
On April 27, 2019
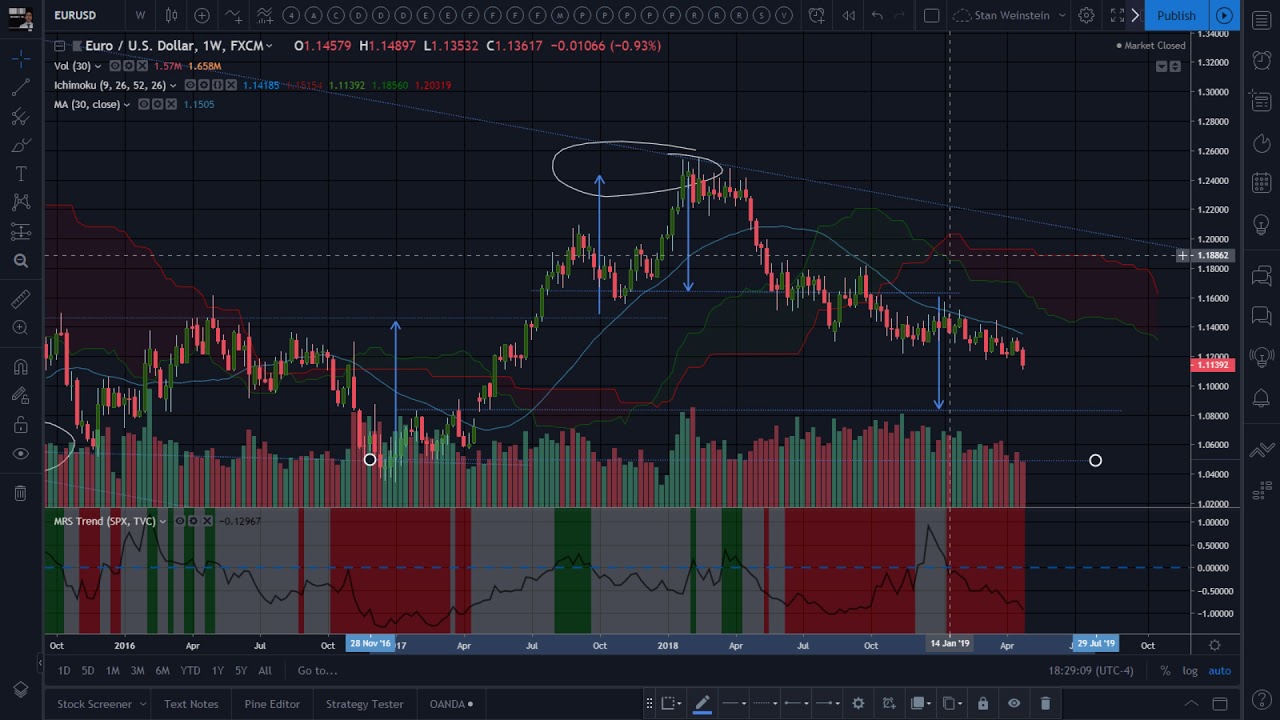
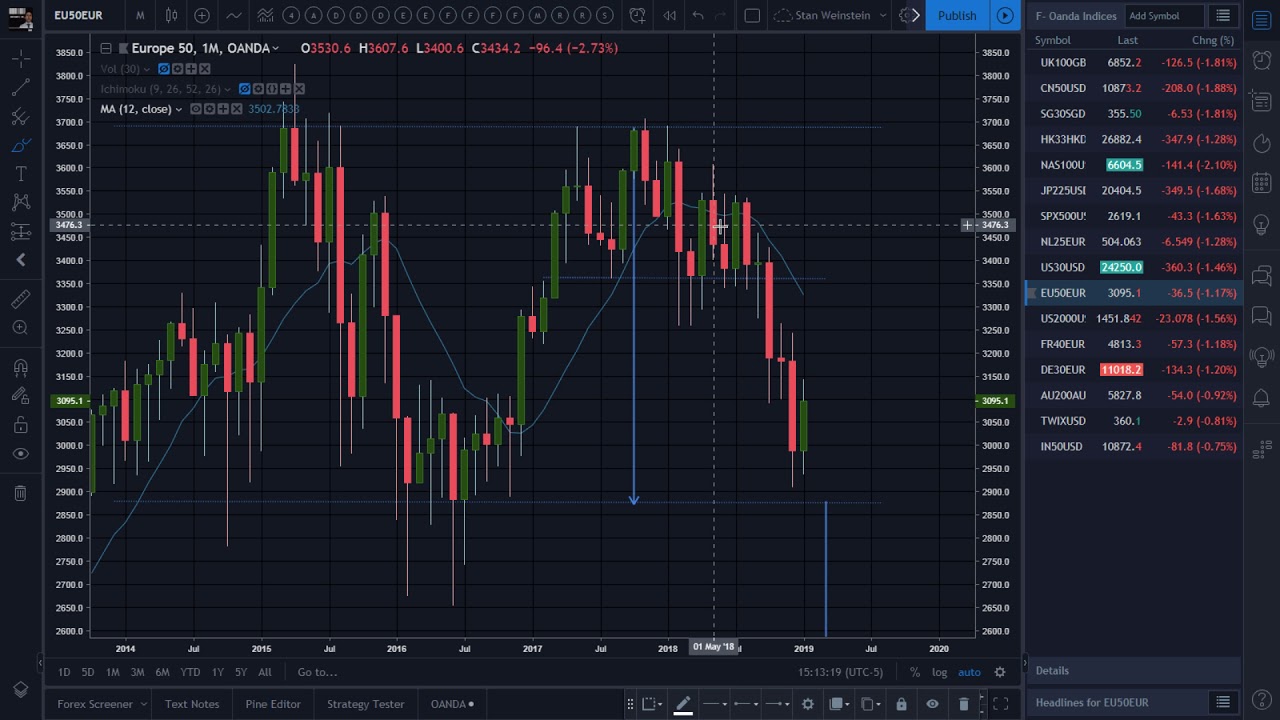
Secretwars #0422 – Forex Review: Euro losing the battle vs US Dollar.
On April 26, 2019
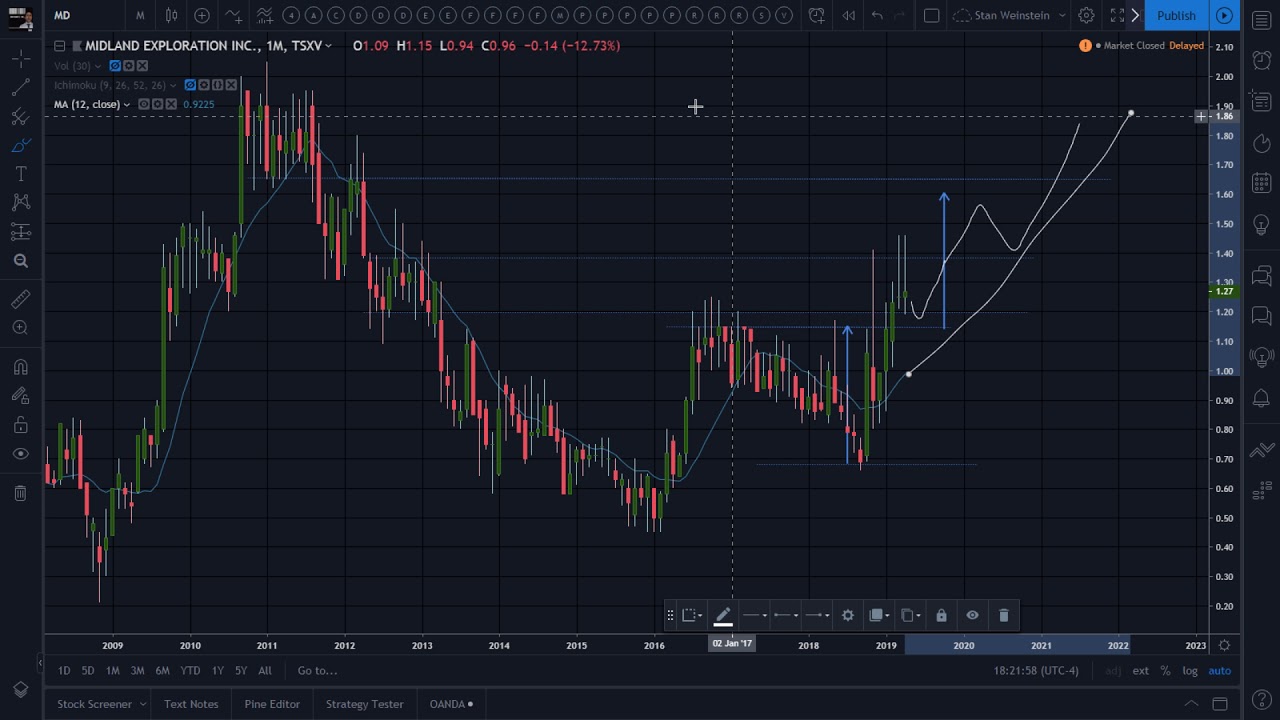
Secretwars #0421 – Midland Exploration Inc. in a confirmed Stage 2!
On April 25, 2019
Secretwars #0420 – Markets Review: Going down the Commitments Of Traders rabbit hole!
On April 24, 2019
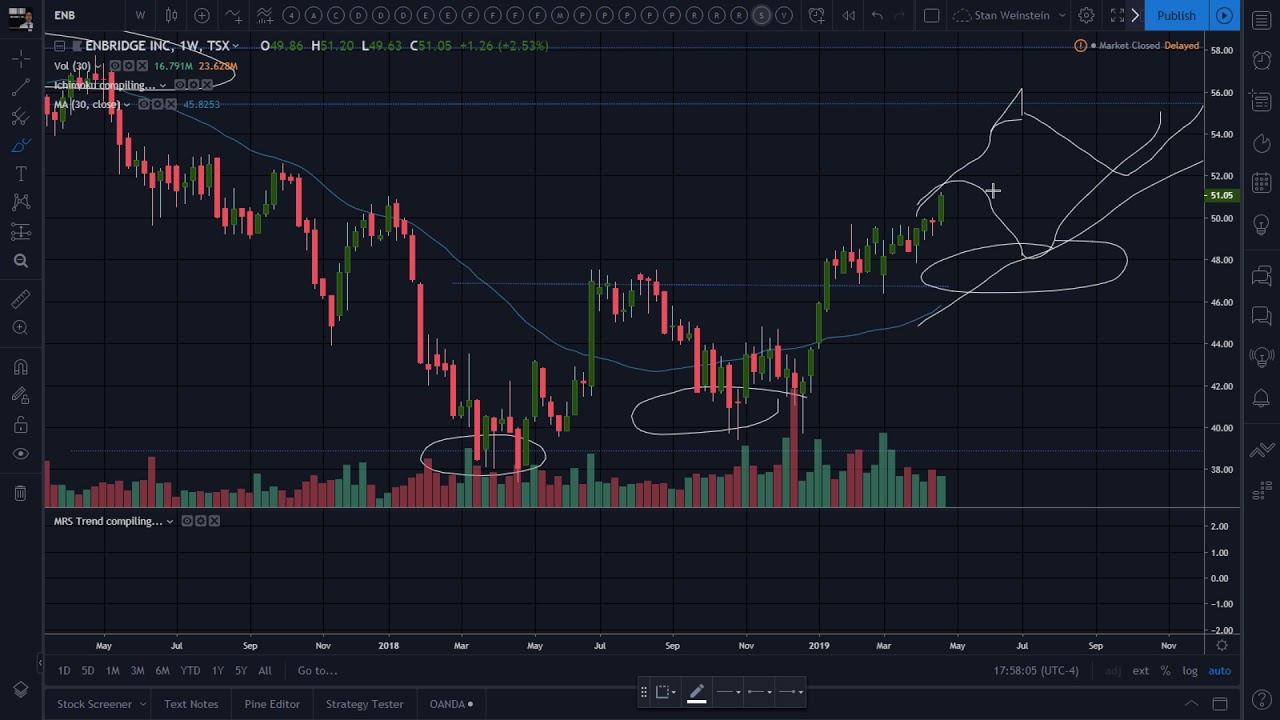
Secretwars #0419 – Revisiting Enbridge Inc., still expanding it’s Stage 2 advance!
On April 23, 2019
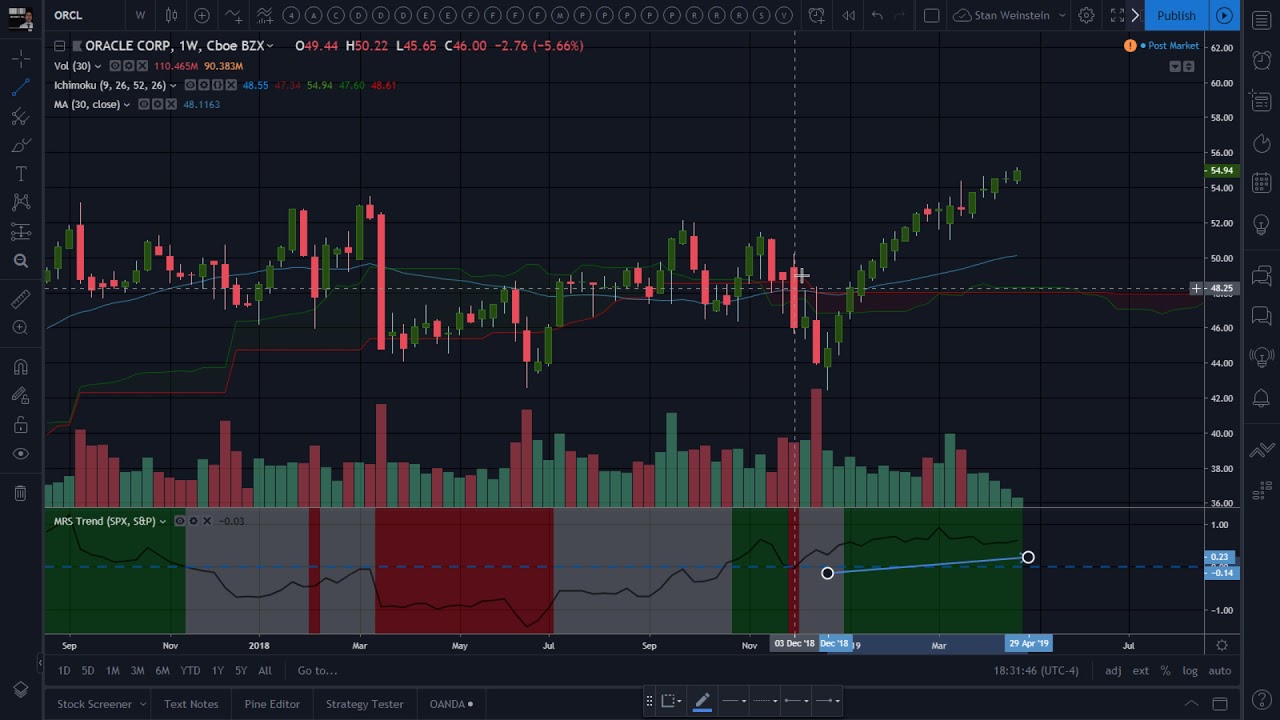
Secretwars #0418 – Oracle rocketing along it’s Stage 2 breakout!
On April 22, 2019
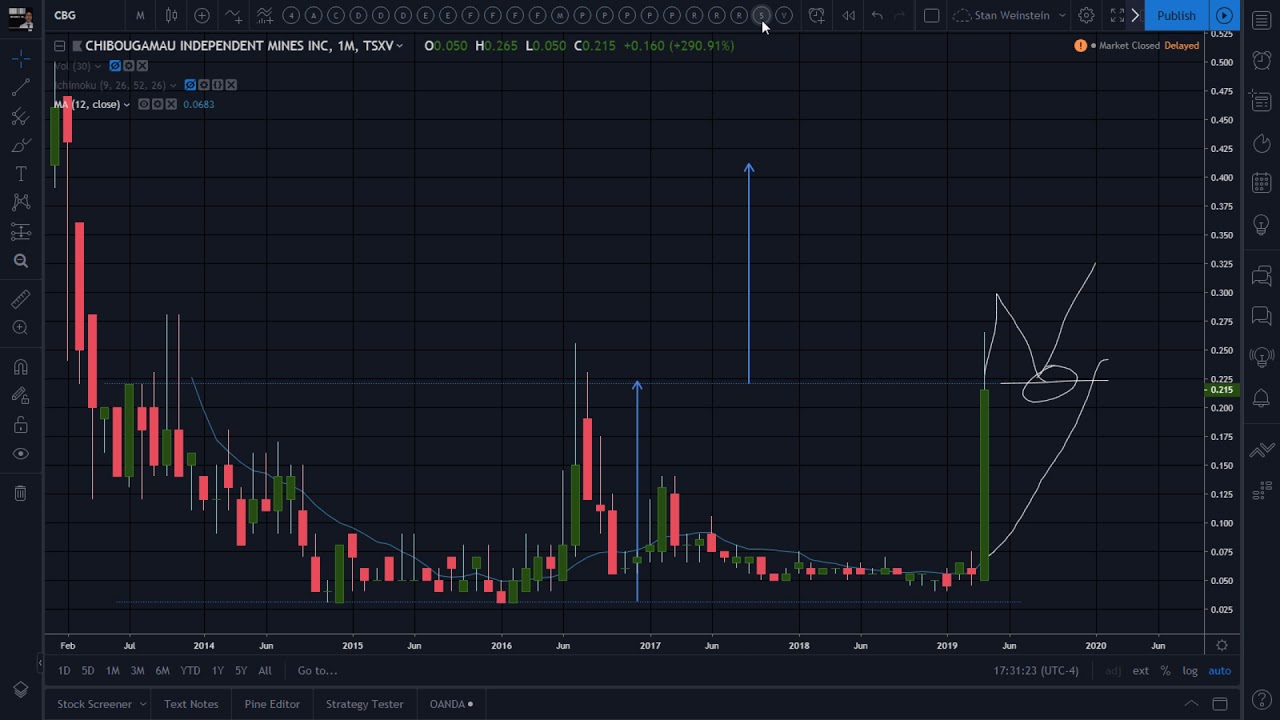
Secretwars #0417 – Chibougamau Independent Mines explodes in a Stage 2!
On April 21, 2019
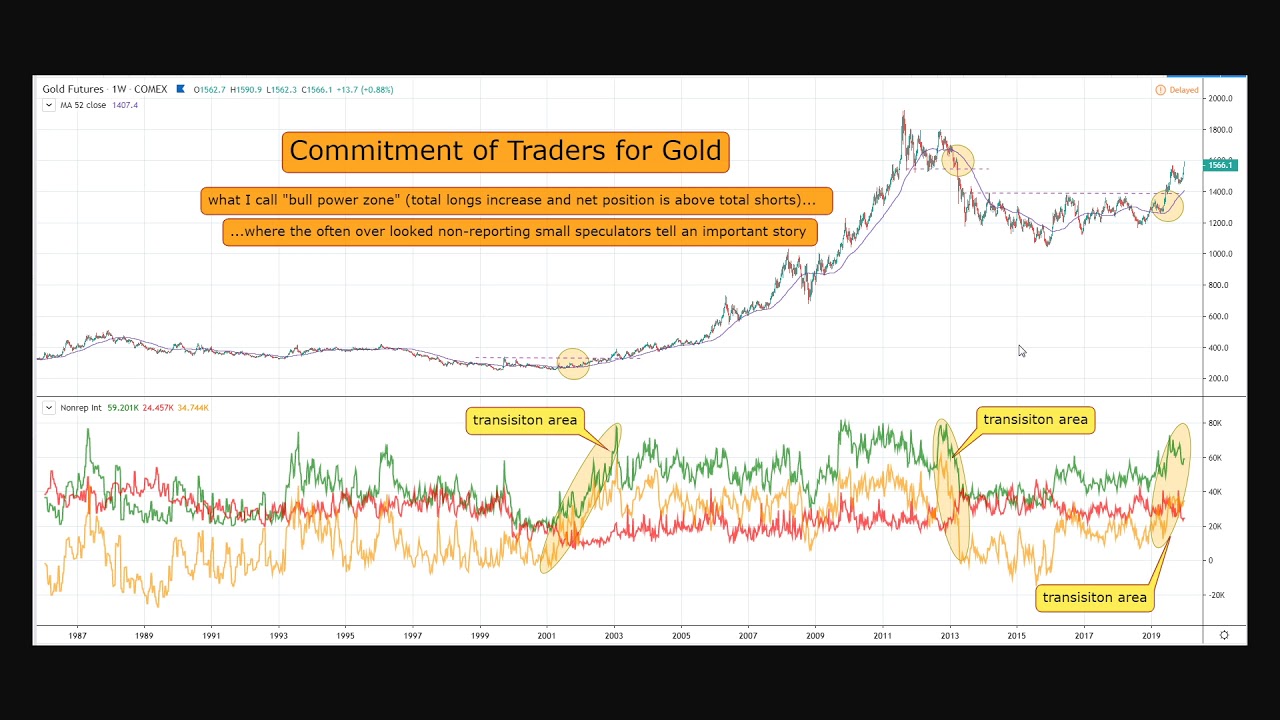
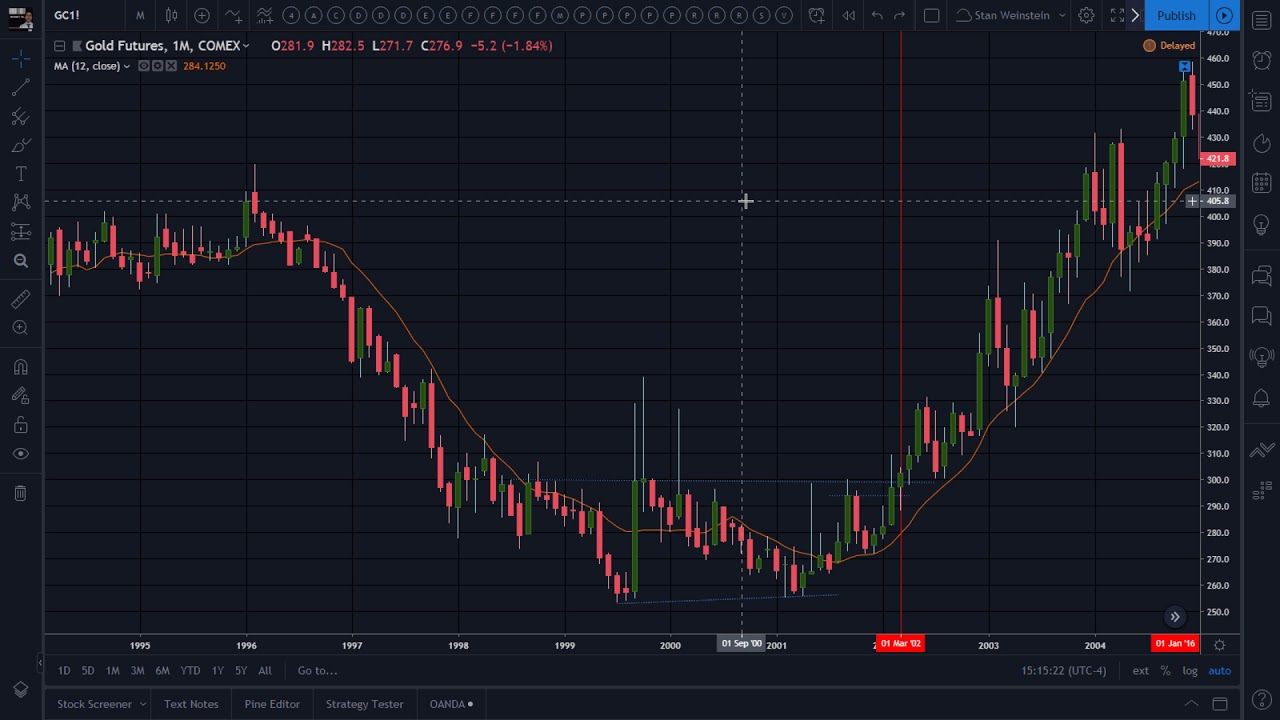
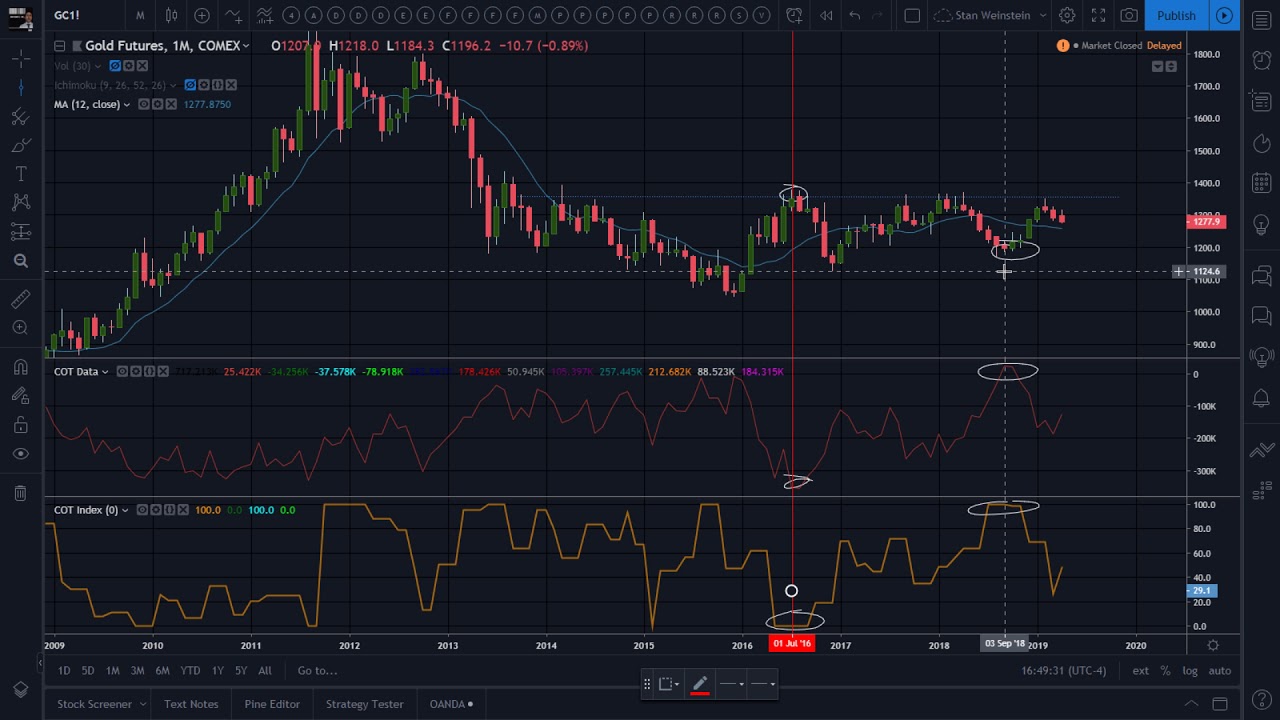
Secretwars #0416 – Markets Review: Commitments Of Traders applied to Gold Futures.
On April 20, 2019
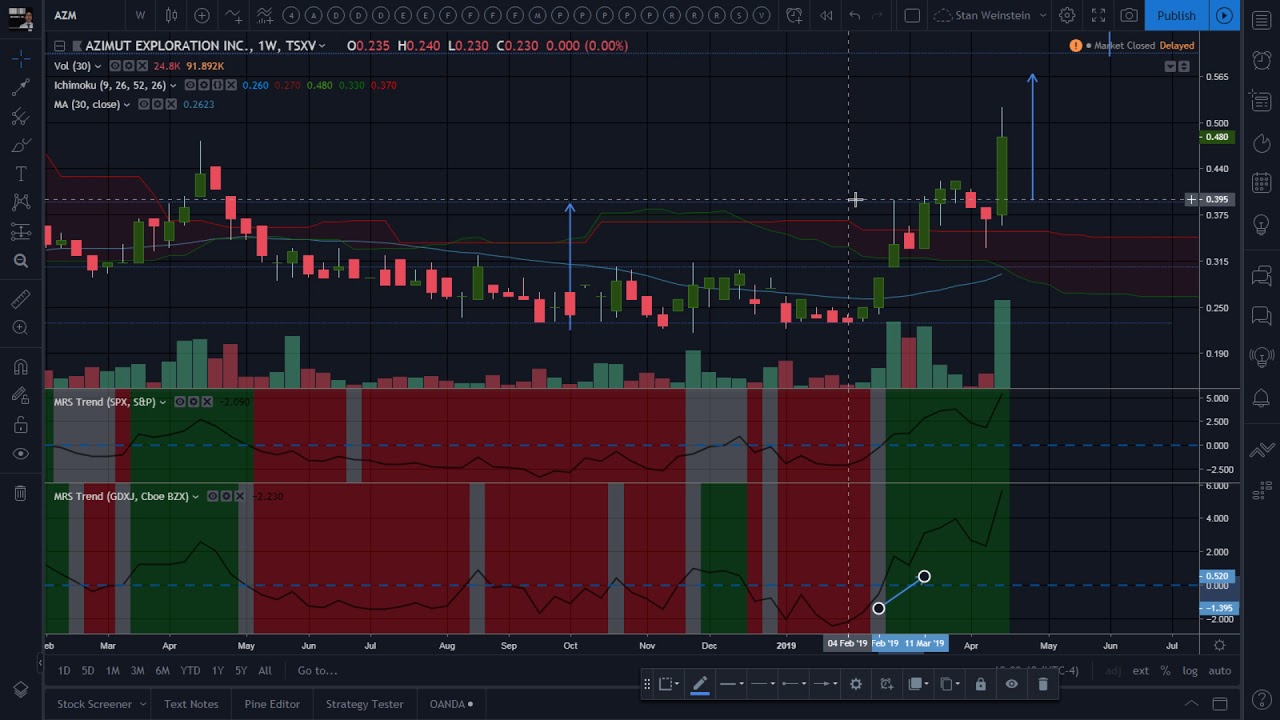
Secretwars #0415 – Azimut Exploration Inc. ready for Stage 2 blast-off!
On April 19, 2019
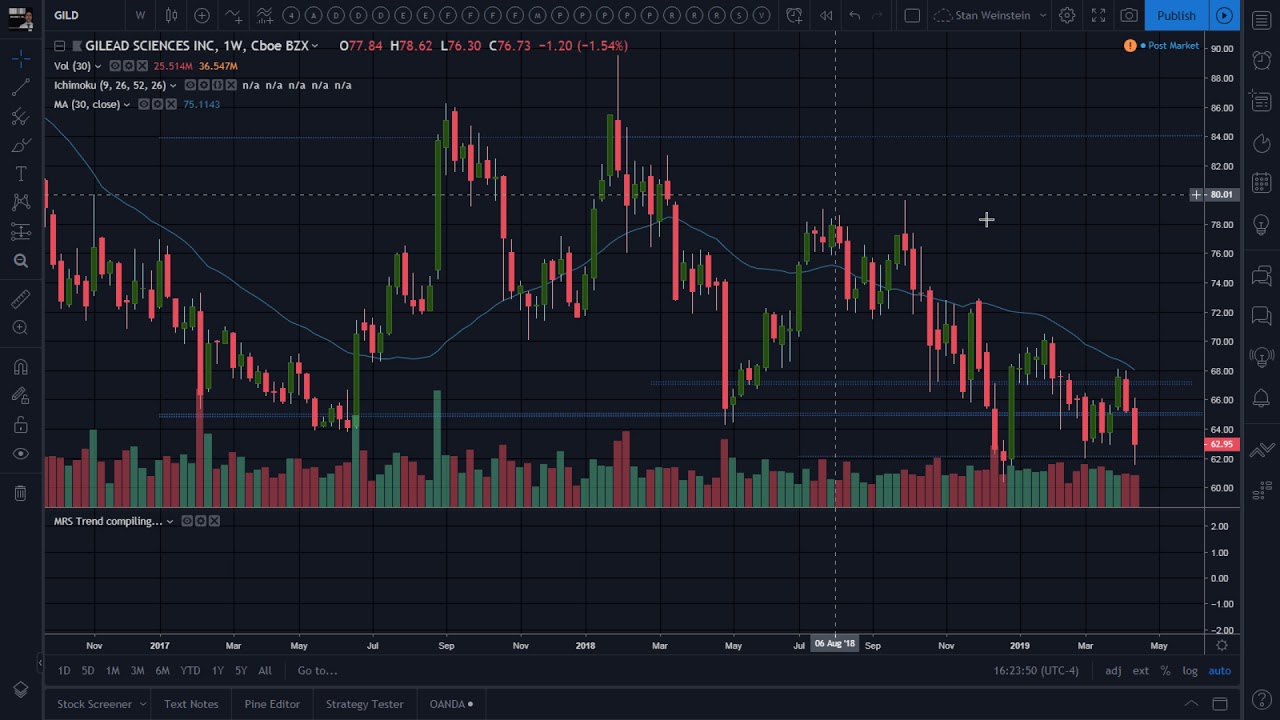
Secretwars #0414 – Revisiting Gilead Sciences, closing in on Stage 4 meltdown!
On April 18, 2019
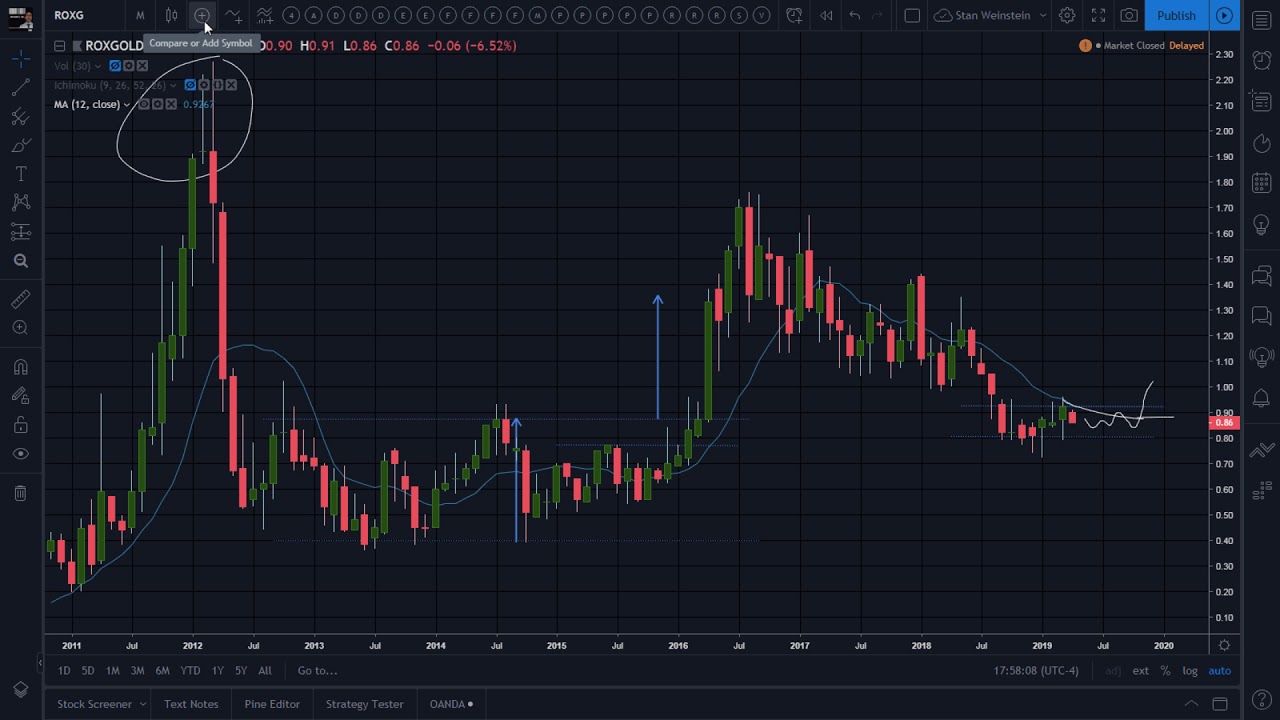
Secretwars #0413 – Roxgold Inc. preparing a Stage 1 entry.
On April 17, 2019
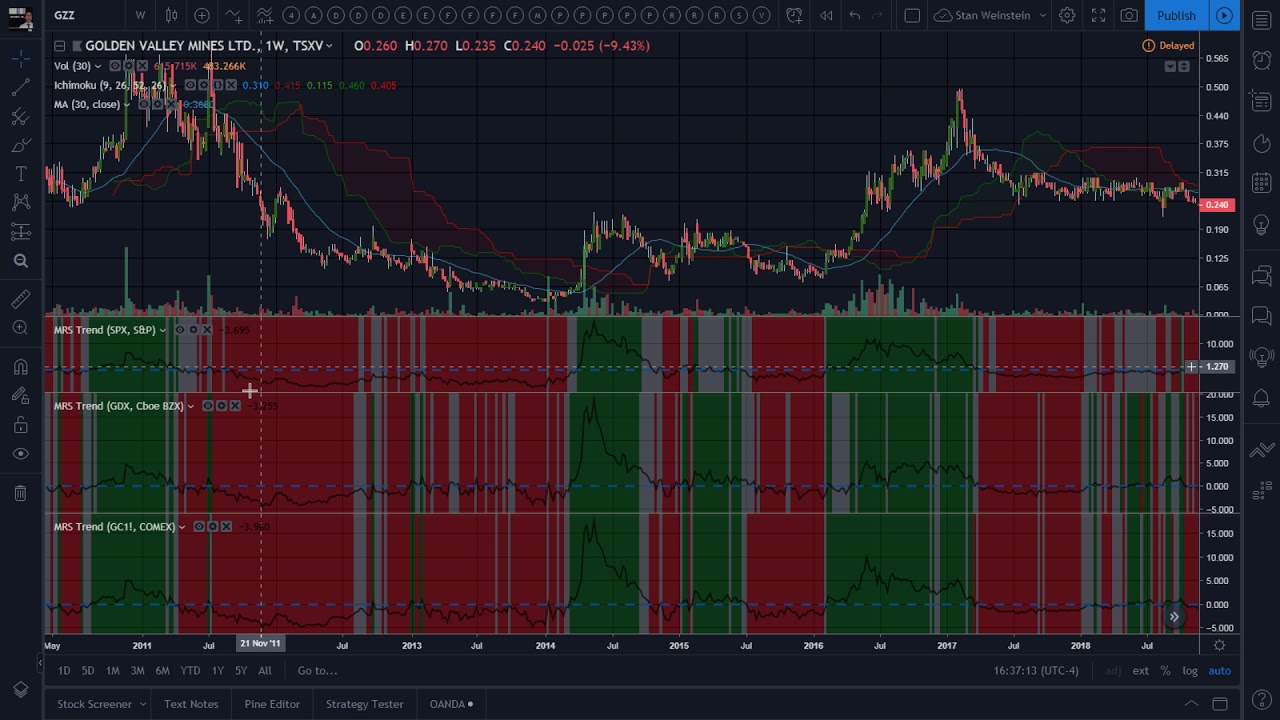
Secretwars #0412 – Golden Valley Mines building a nice Stage 2 breakout!
On April 16, 2019
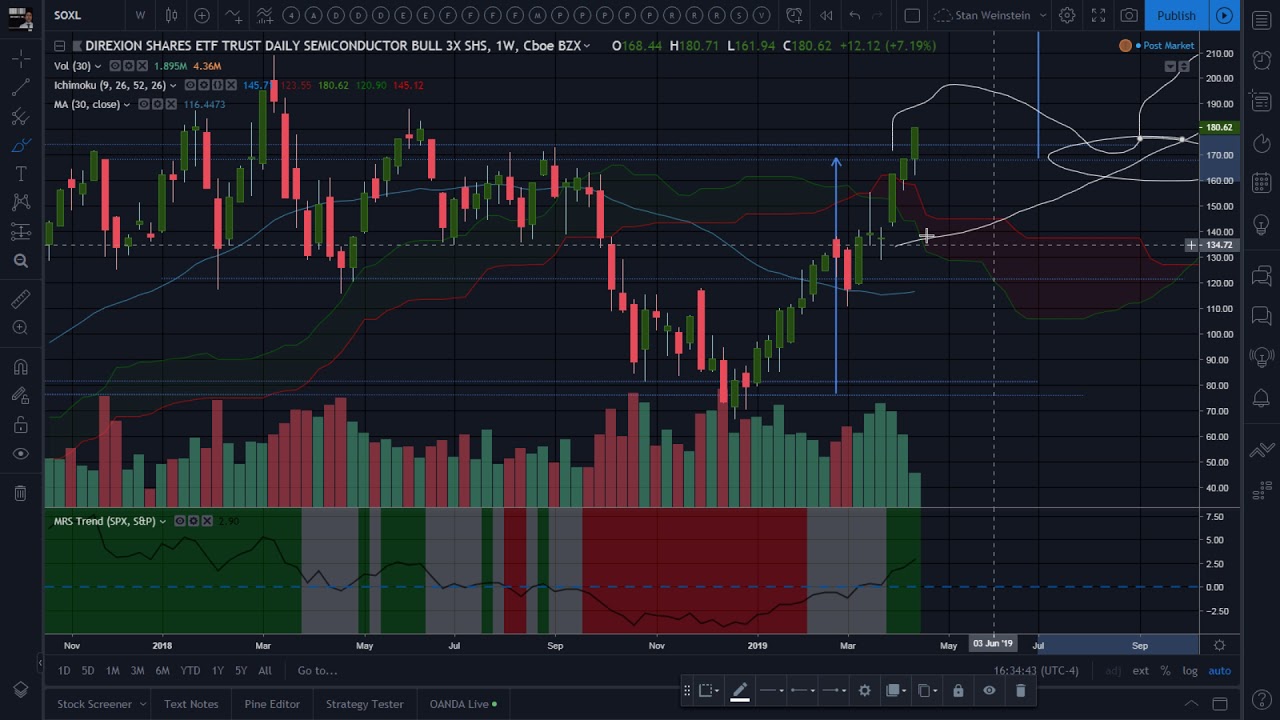
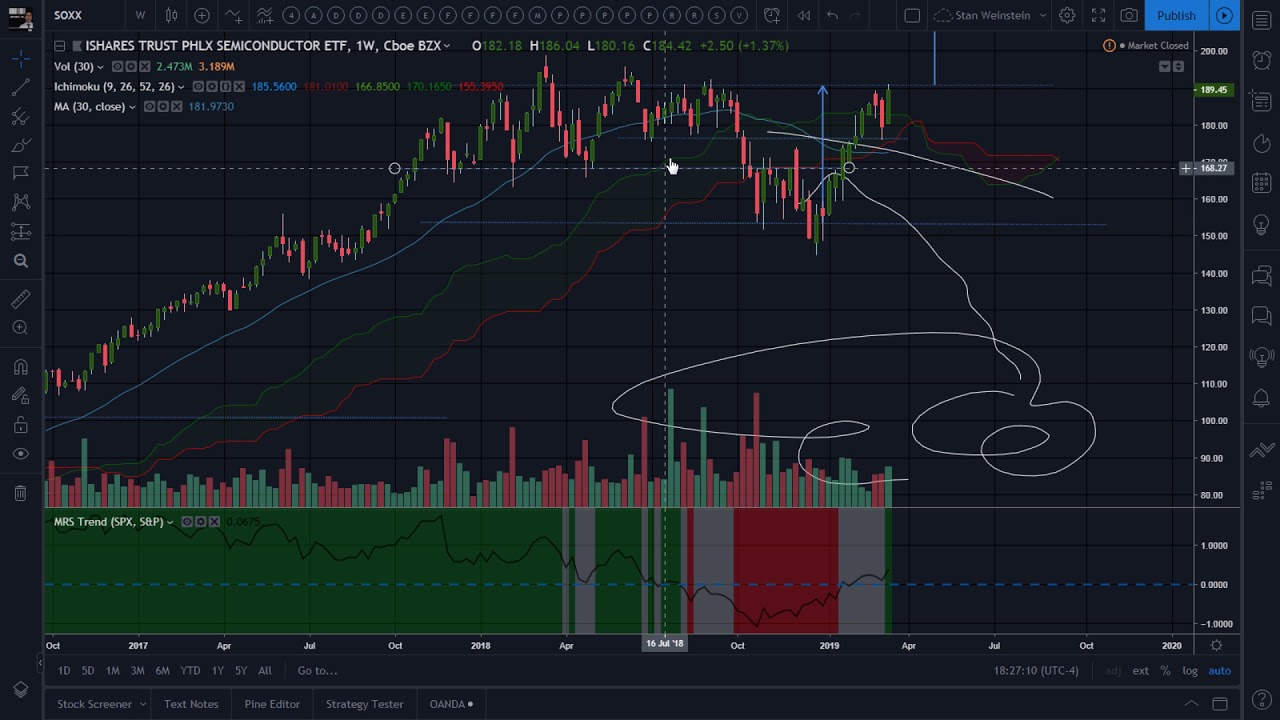
Secretwars #0411 – Markets Review: Semiconductors back in a Stage 2!
On April 15, 2019
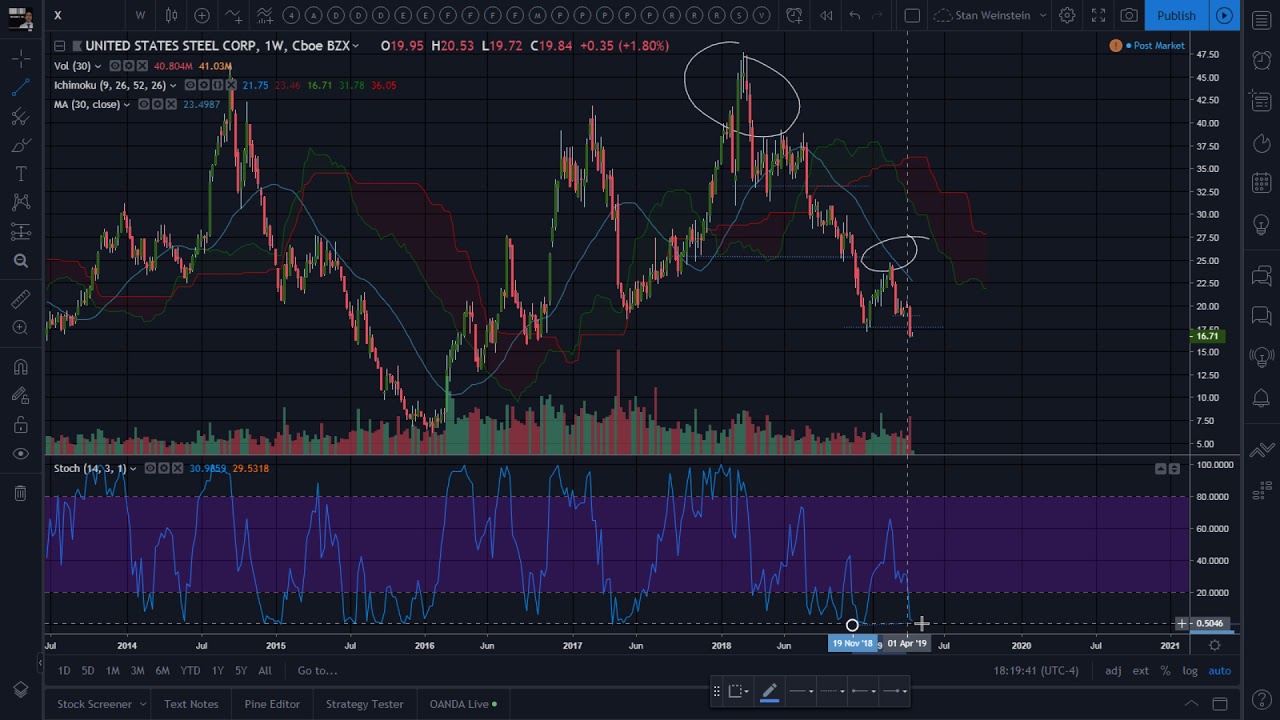
Secretwars #0410 – When will United States Steel Corp. turn around?
On April 14, 2019
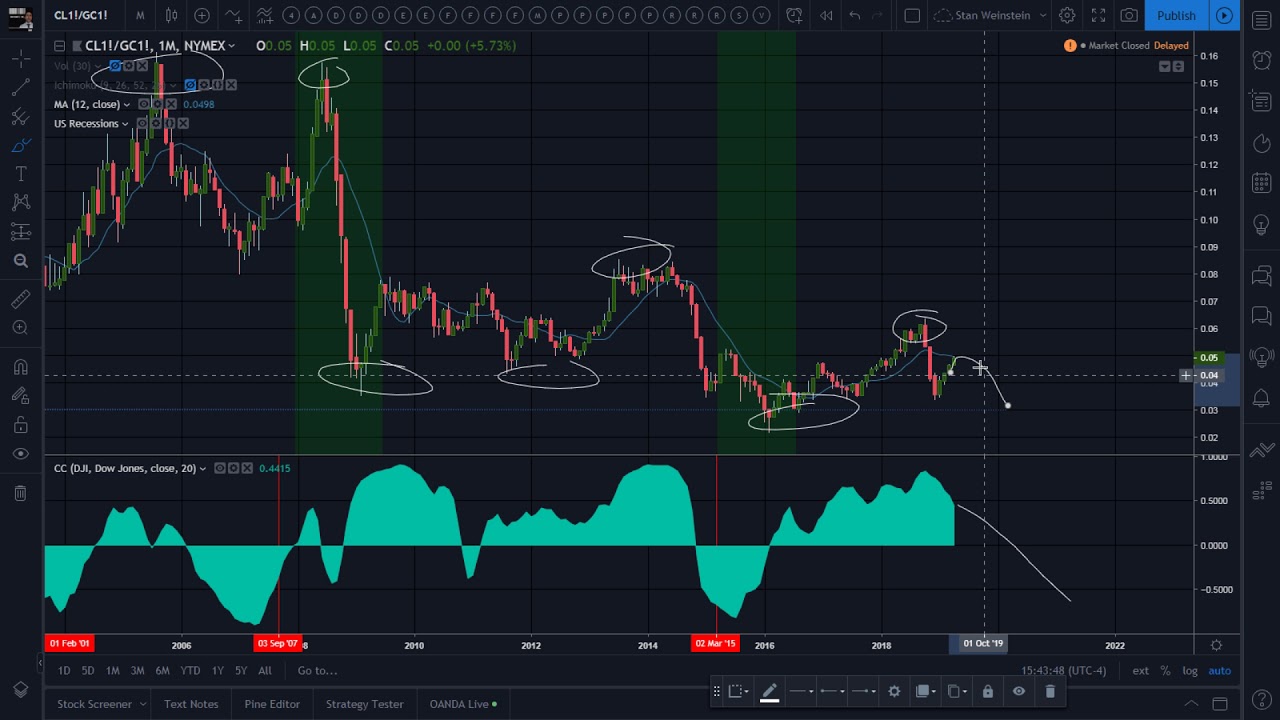
Secretwars #0409 – Markets Review: Oil Futures versus Gold Futures.
On April 13, 2019
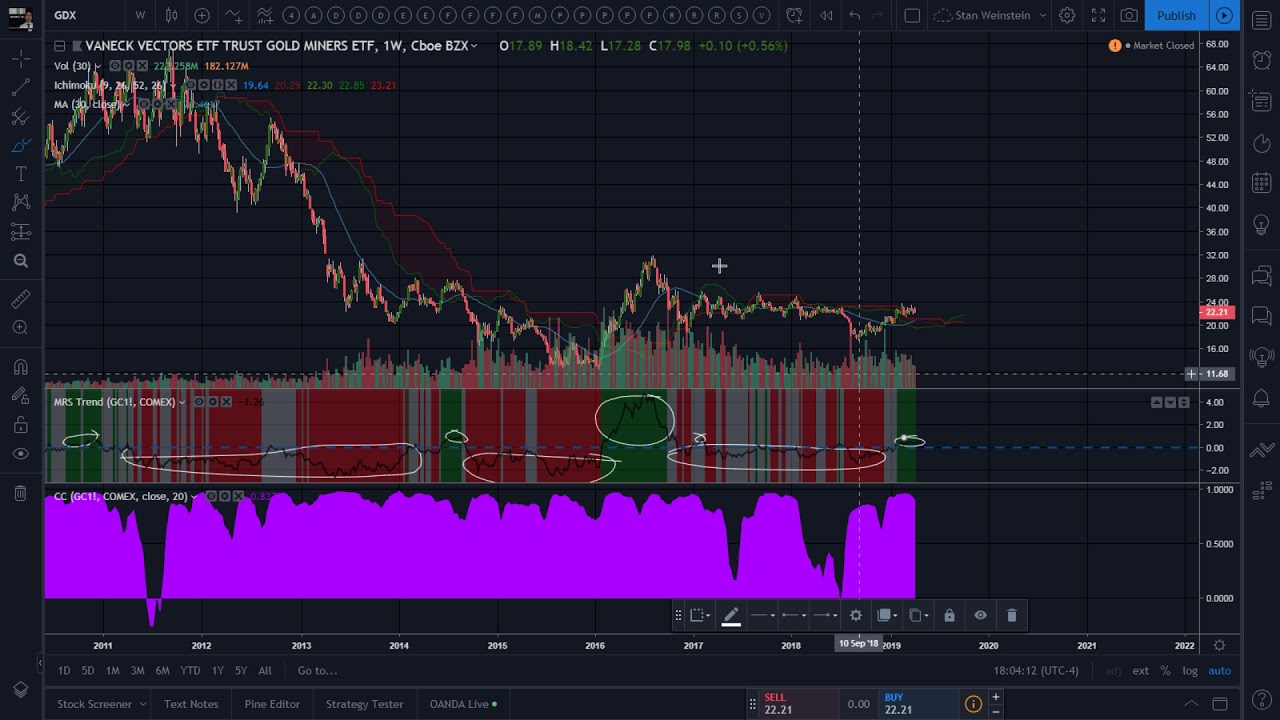
Secretwars #0408 – Markets Review: Gold Miners OR Gold Futures?
On April 12, 2019
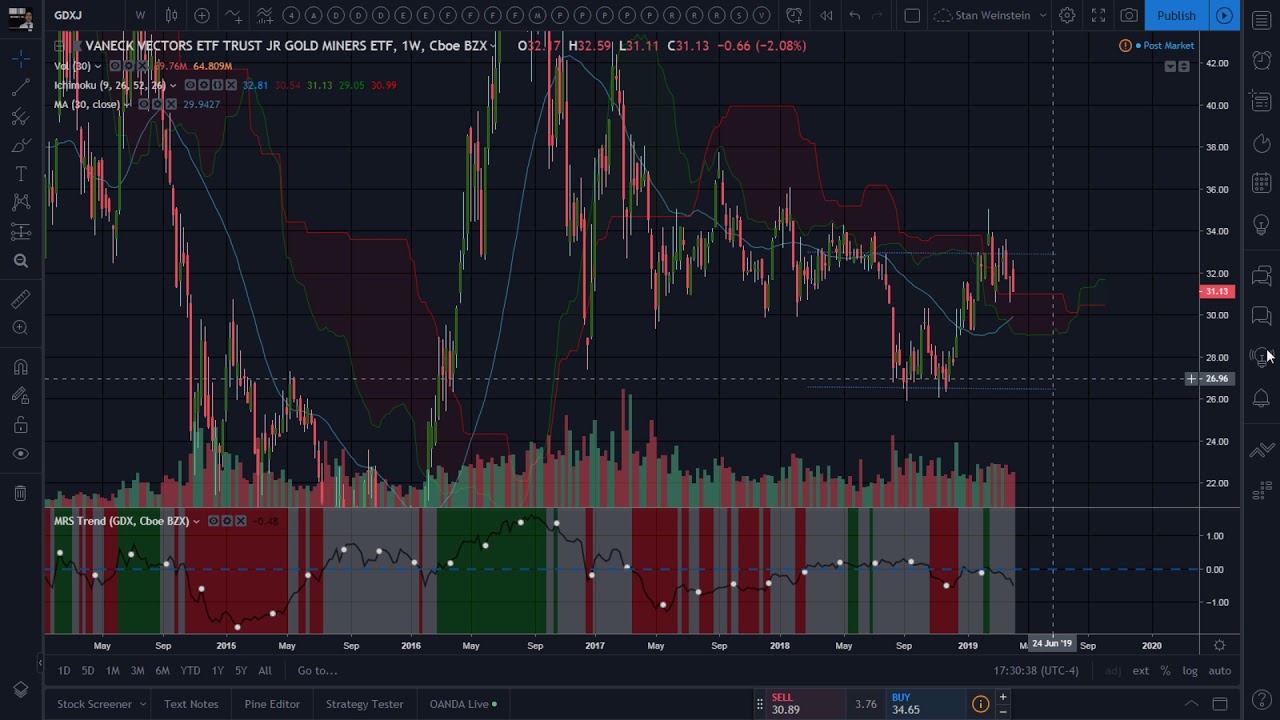
Secretwars #0407 – Markets Review: Vaneck Vectors Junior Gold Miners ETF.
On April 11, 2019
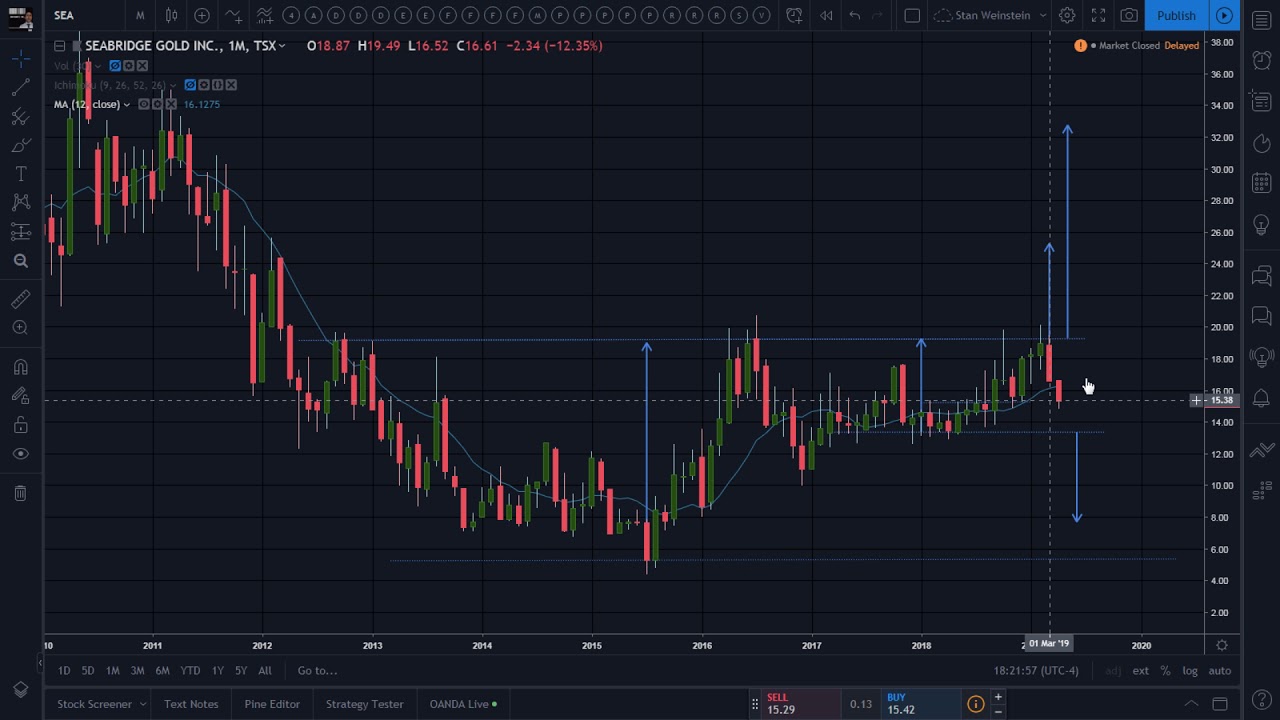
Secretwars #0406 – Failed Stage 2 breakout for Seabridge Gold, now what?
On April 10, 2019
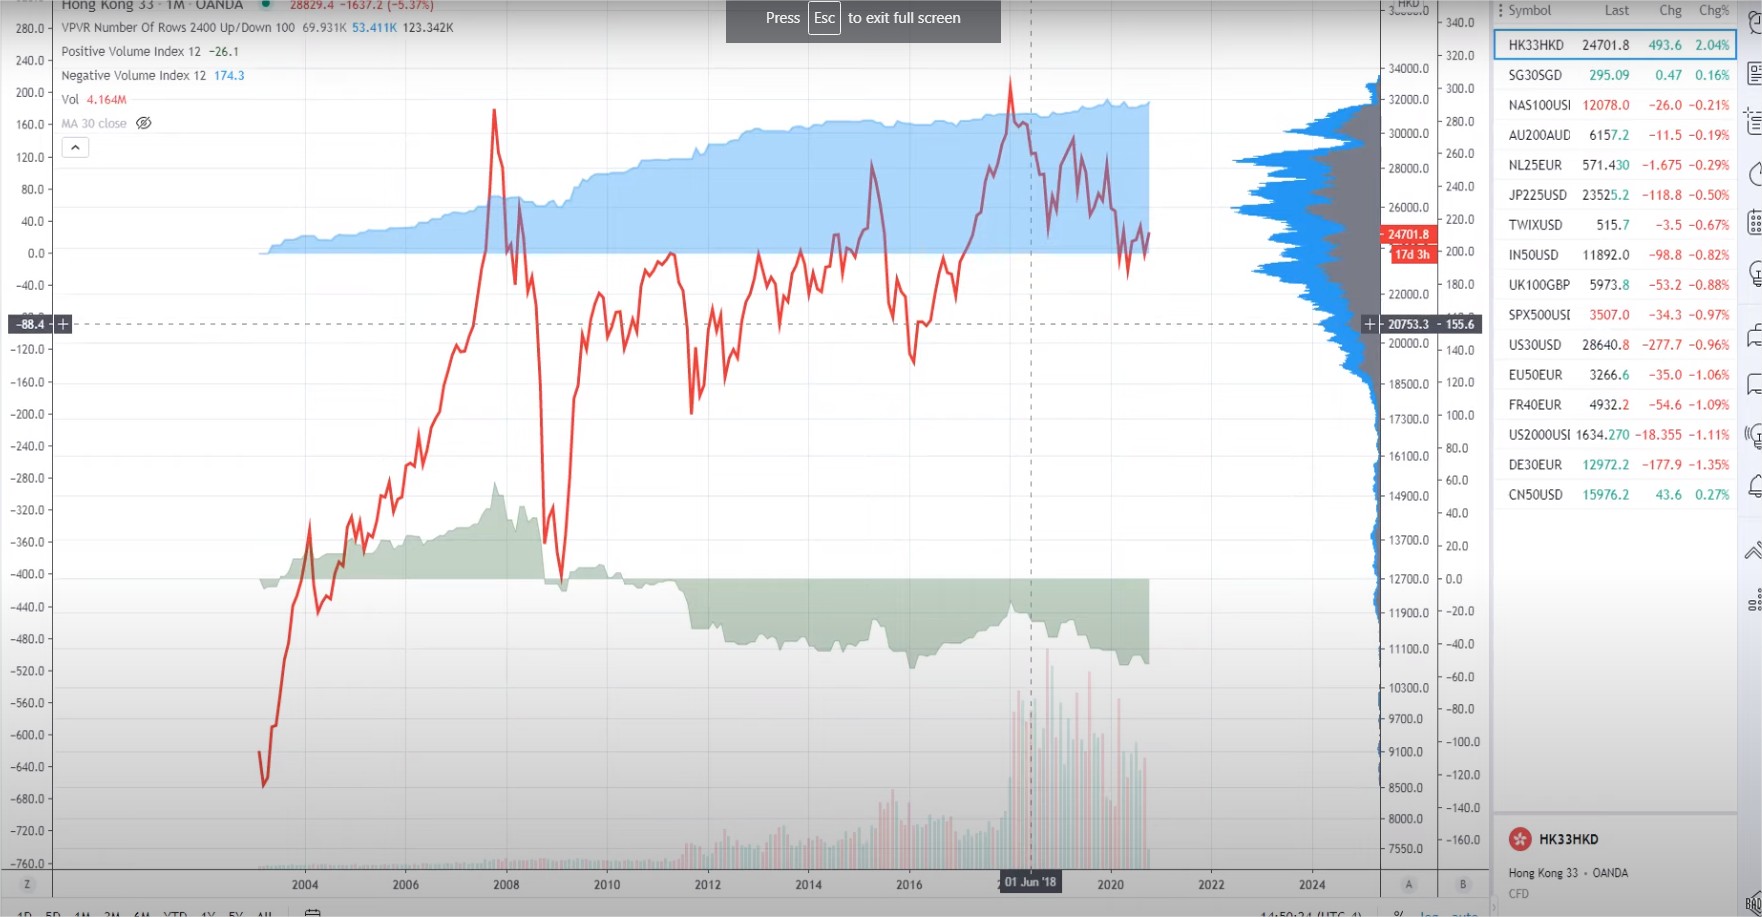
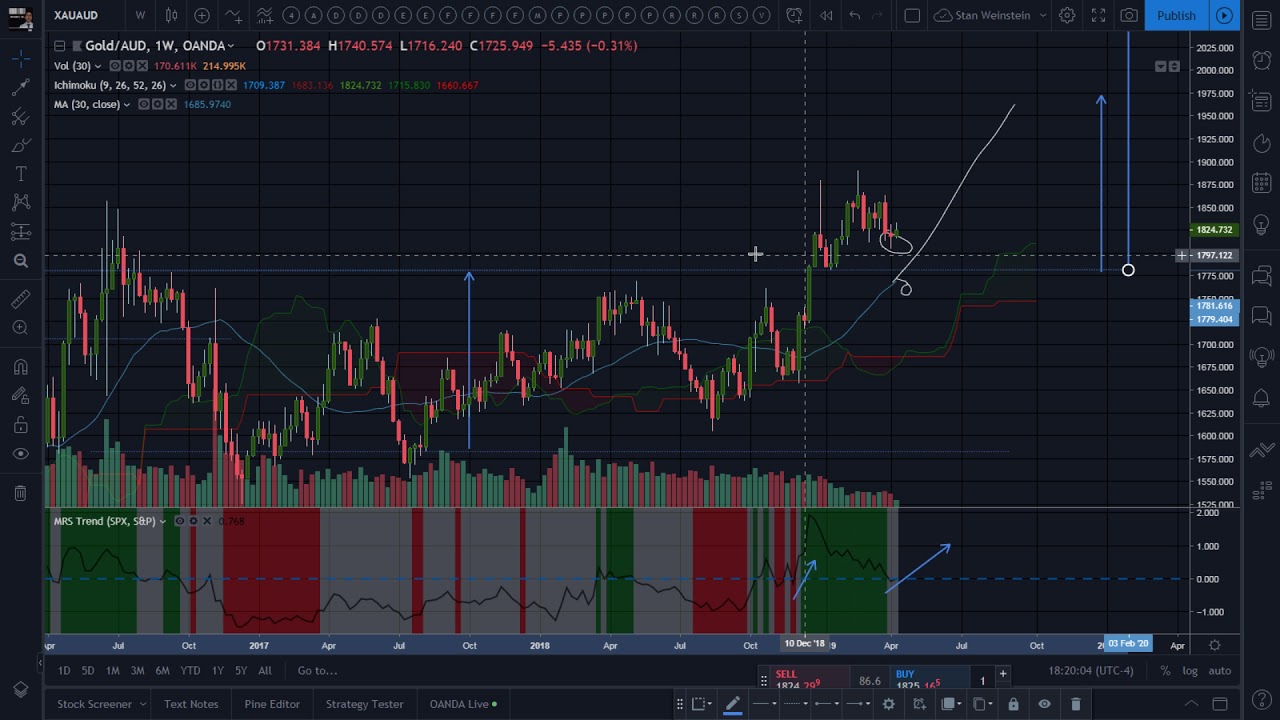
Secretwars #0405 – Markets Review: Gold in Australian Dollars has already broken out!
On April 9, 2019
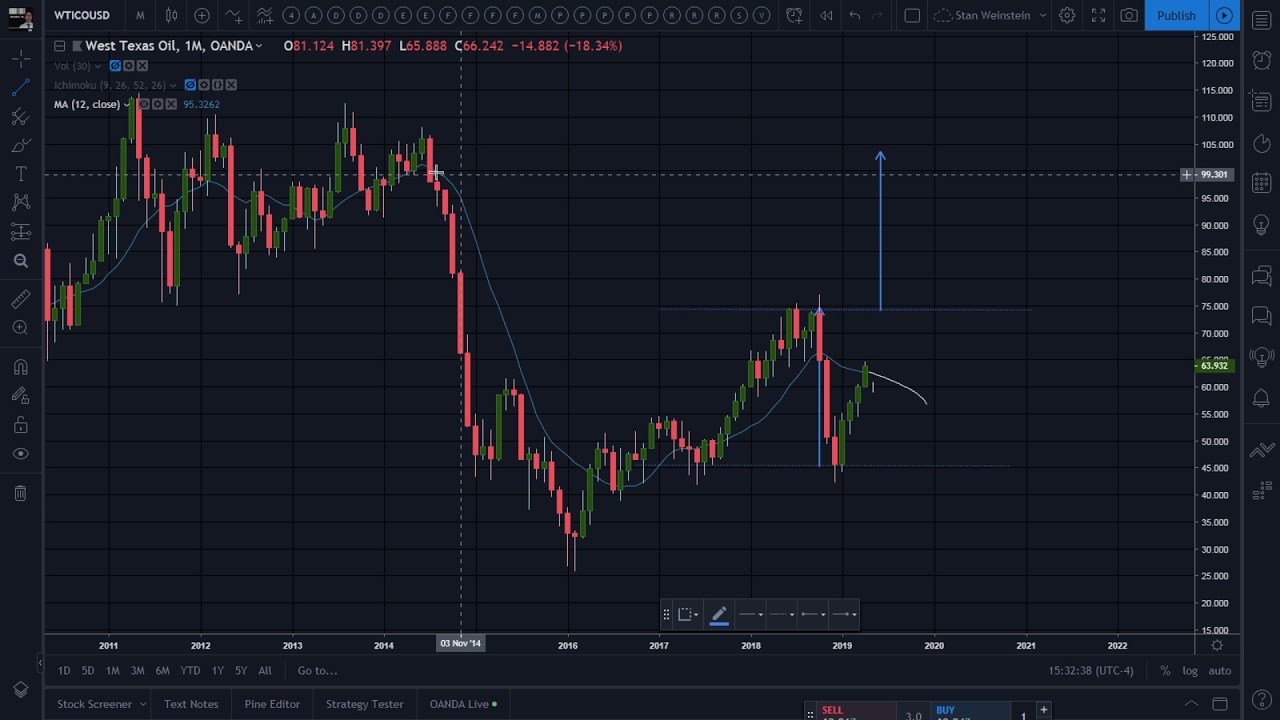
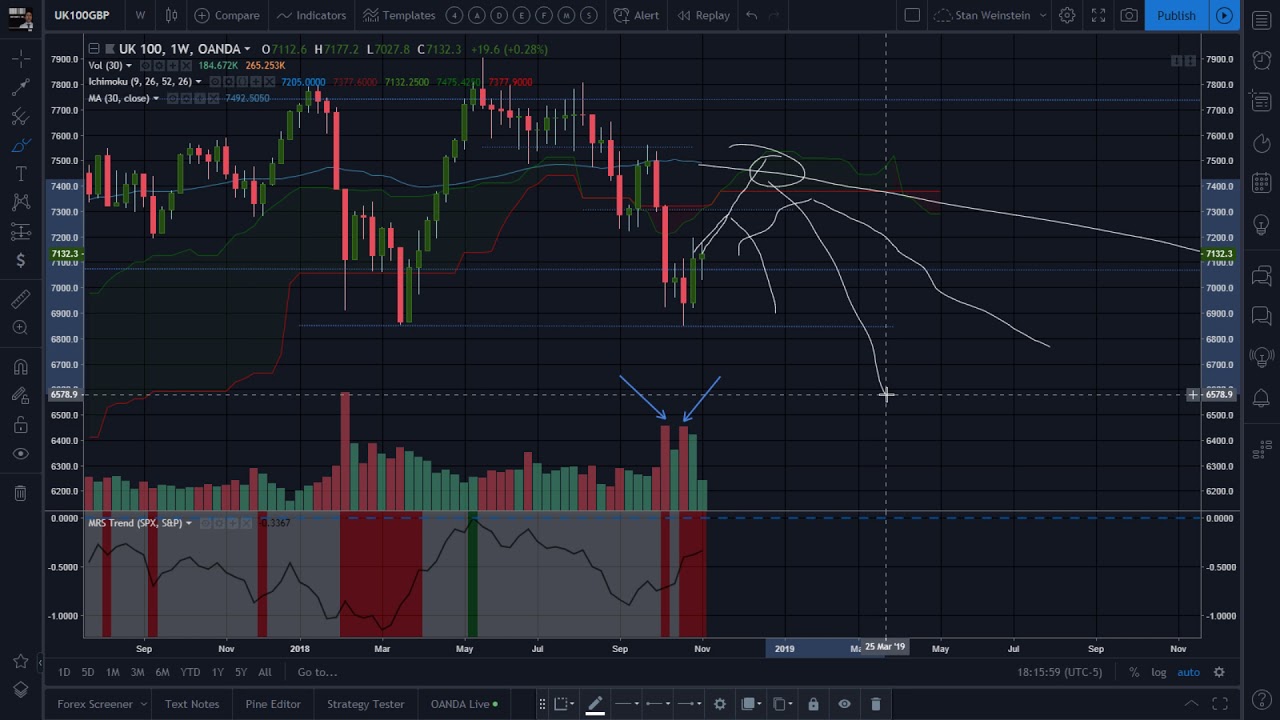
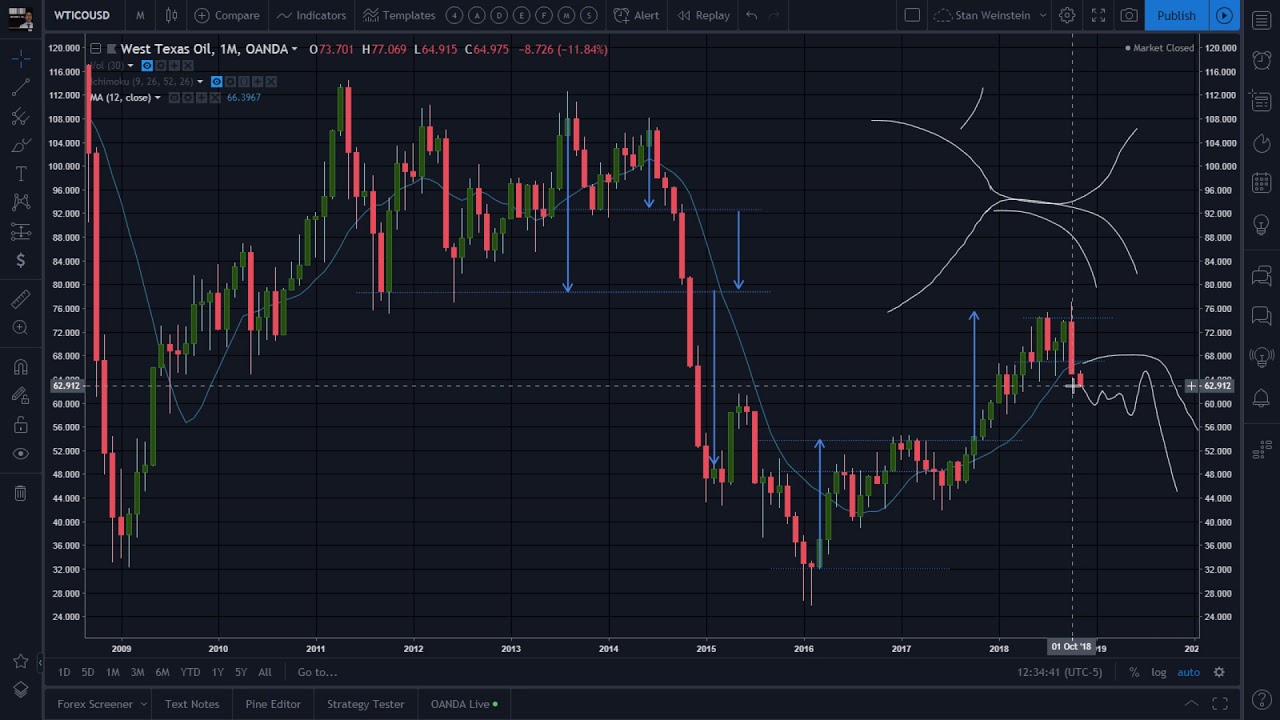
Secretwars #0404 – Markets Review: West Texas Oil entering no-man’s land!
On April 9, 2019
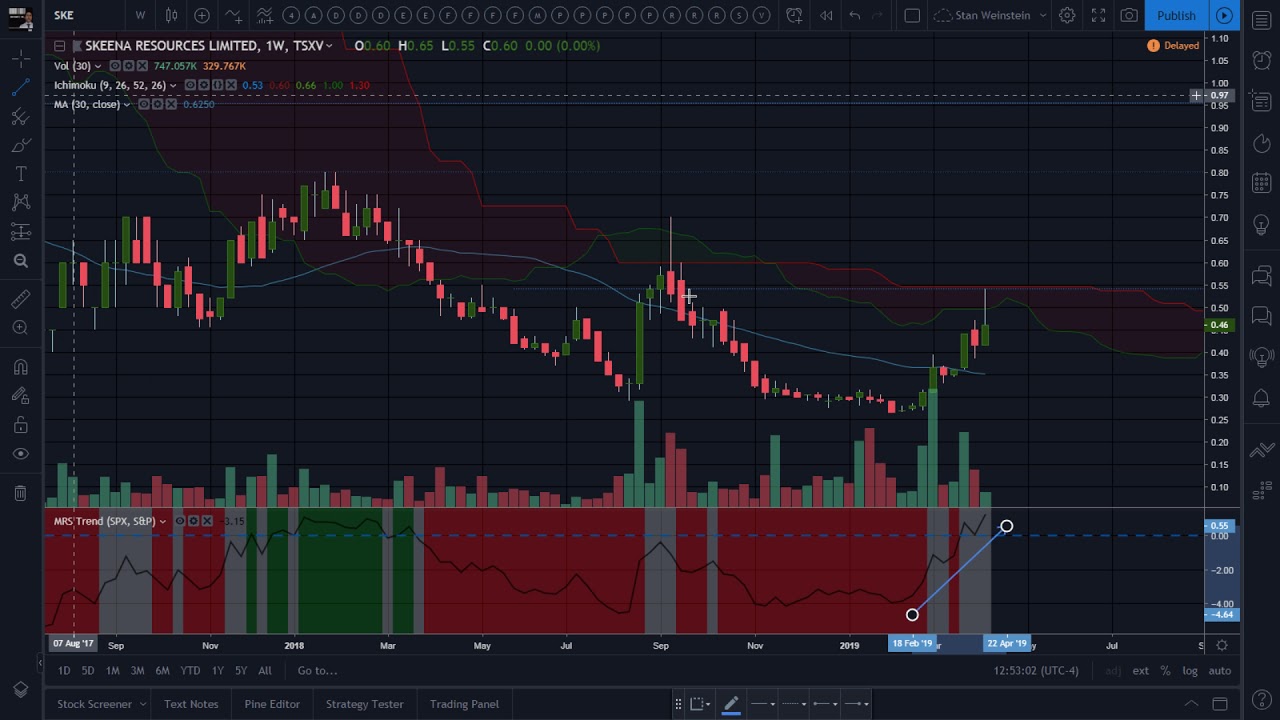
Secretwars #0403 – Skeena Resources Limited, entering embryonic Stage 2 territory!
On April 7, 2019
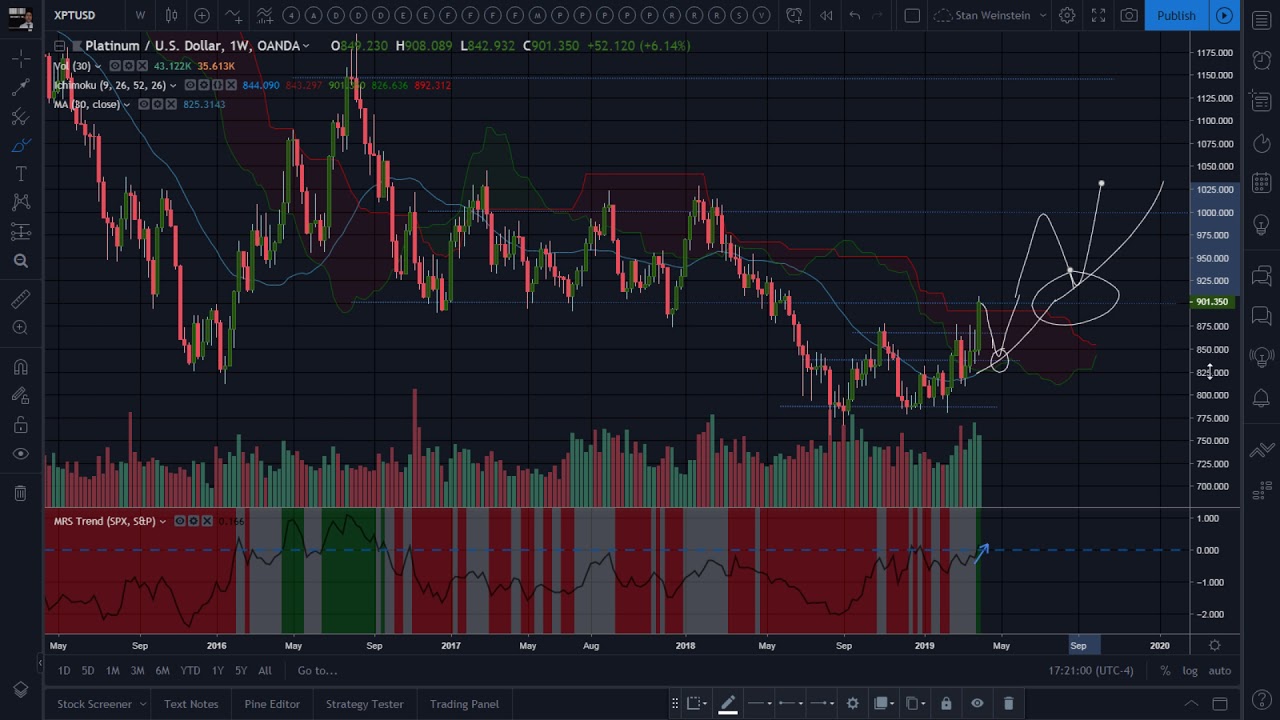
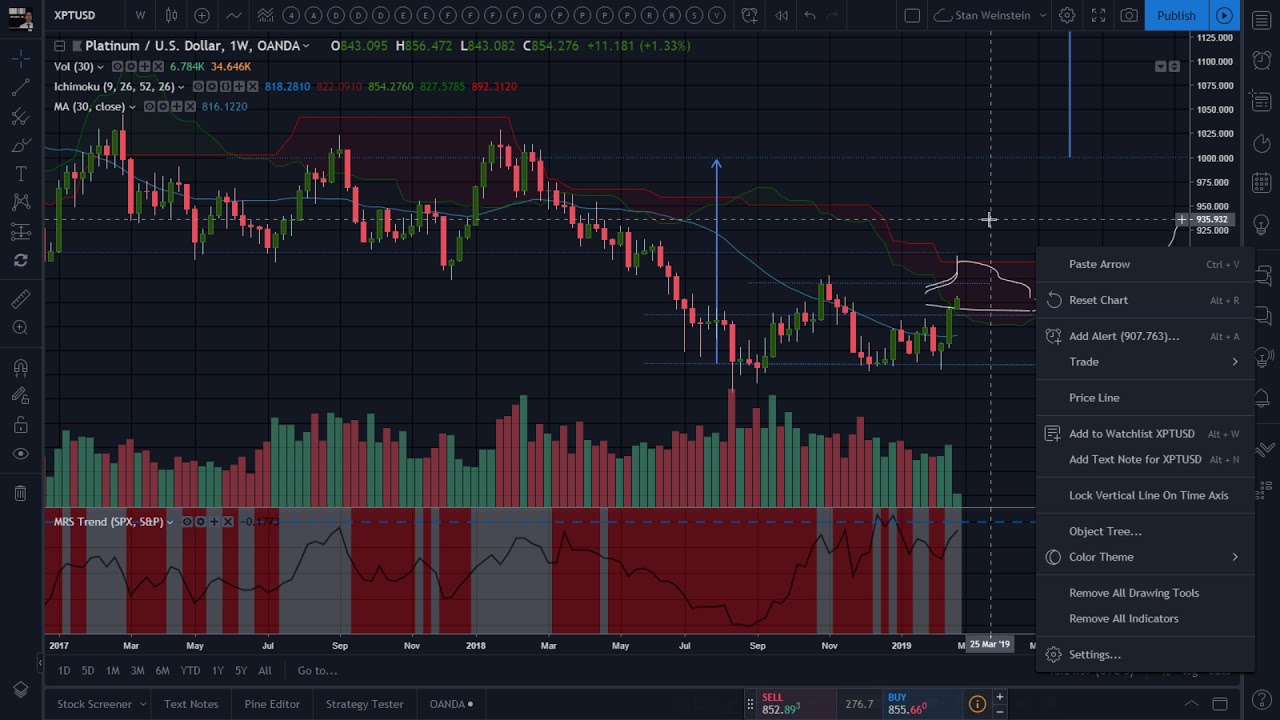
Secretwars #0402 – Markets Review: Revisiting Platinum expressed in US Dollars.
On April 6, 2019
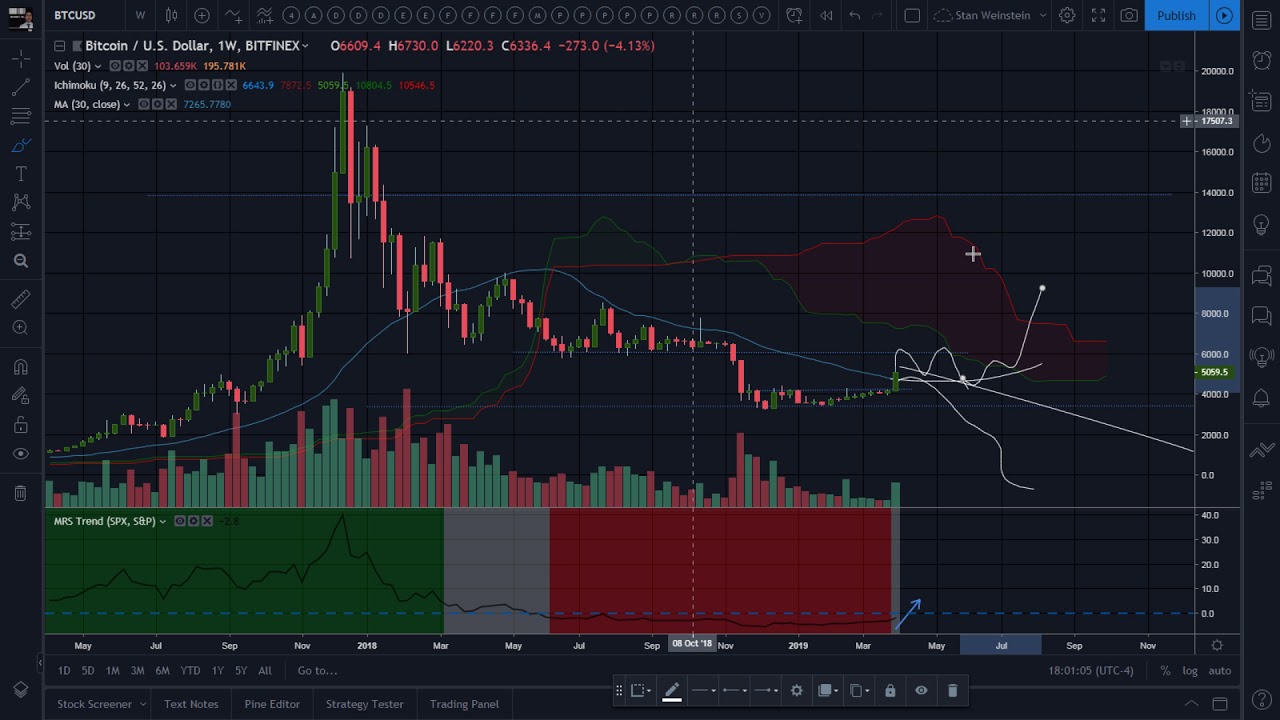
Secretwars #0401 – Bitcoin expressed in US Dollars.
On April 5, 2019
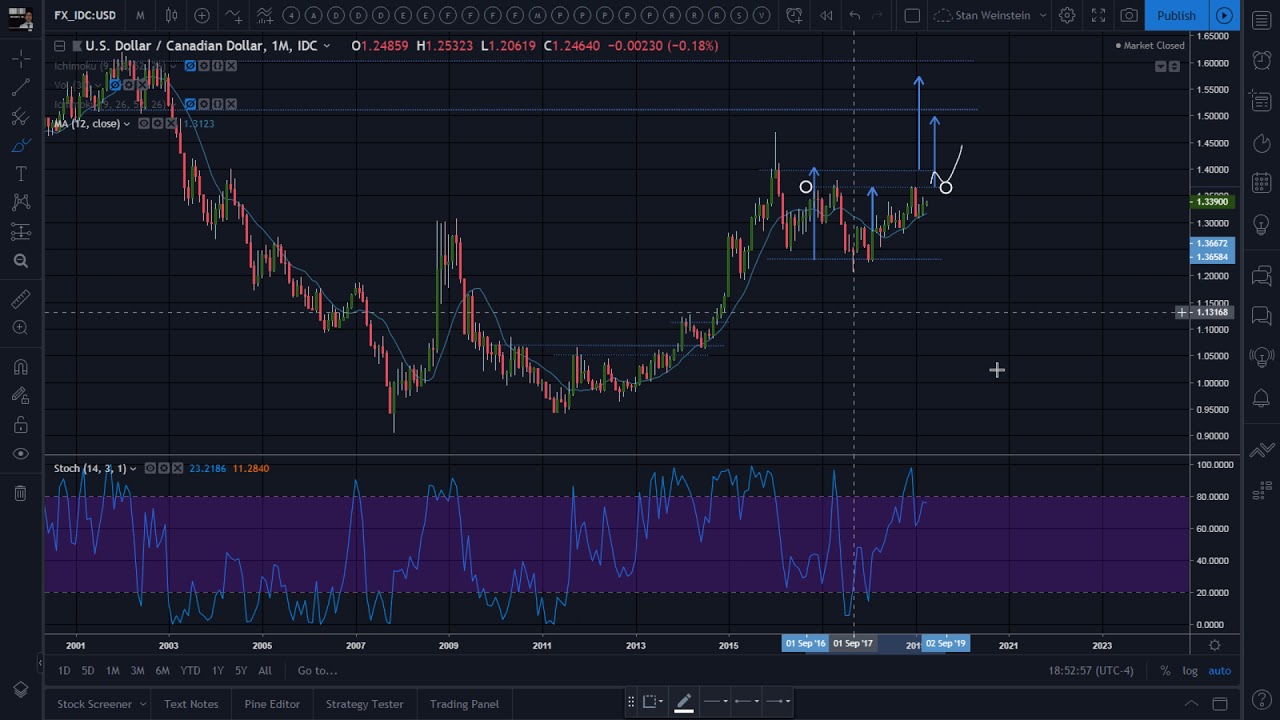
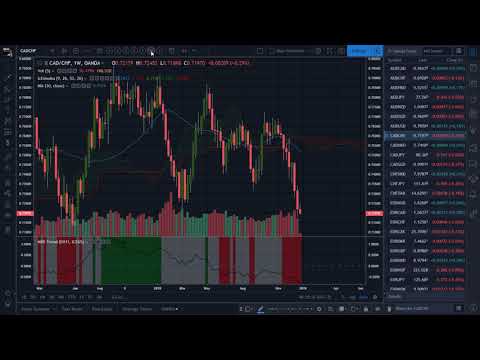
Secretwars #0400 – Forex Review: US Dollar vs Canadian Dollar.
On April 4, 2019
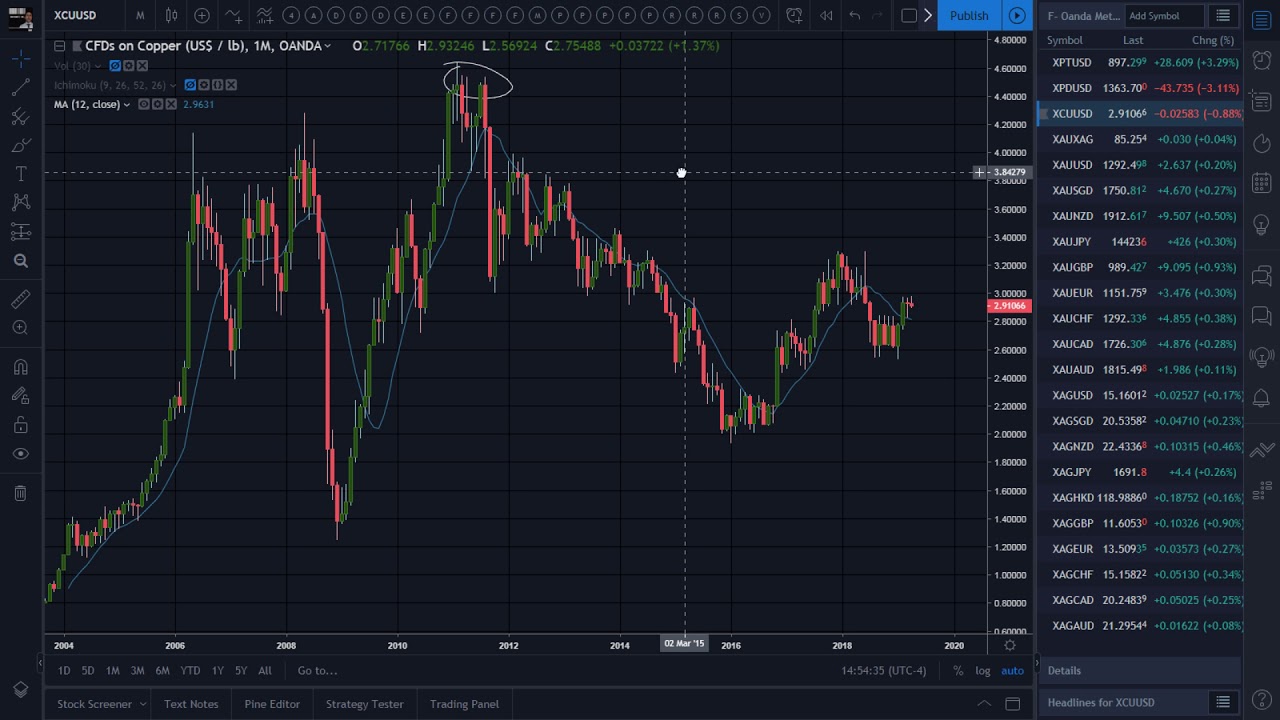
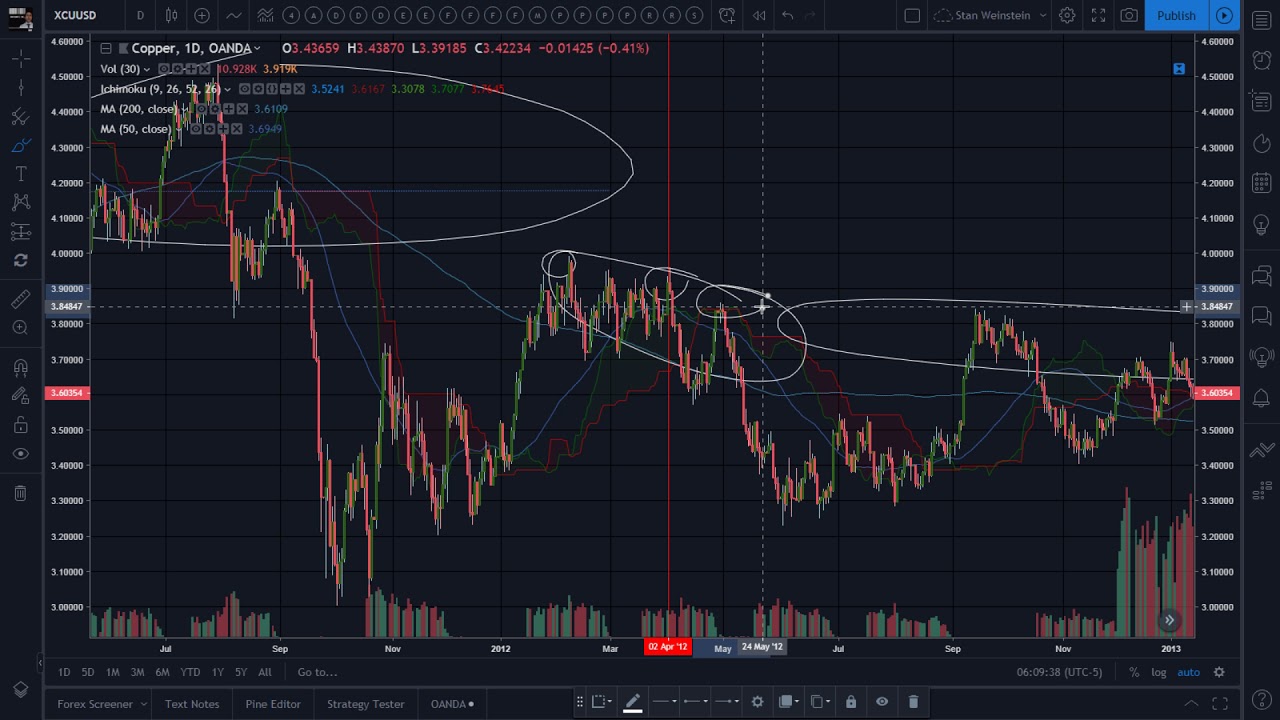
Secretwars #0399 – Markets Review: Copper now poised for an upside breakout!
On April 3, 2019
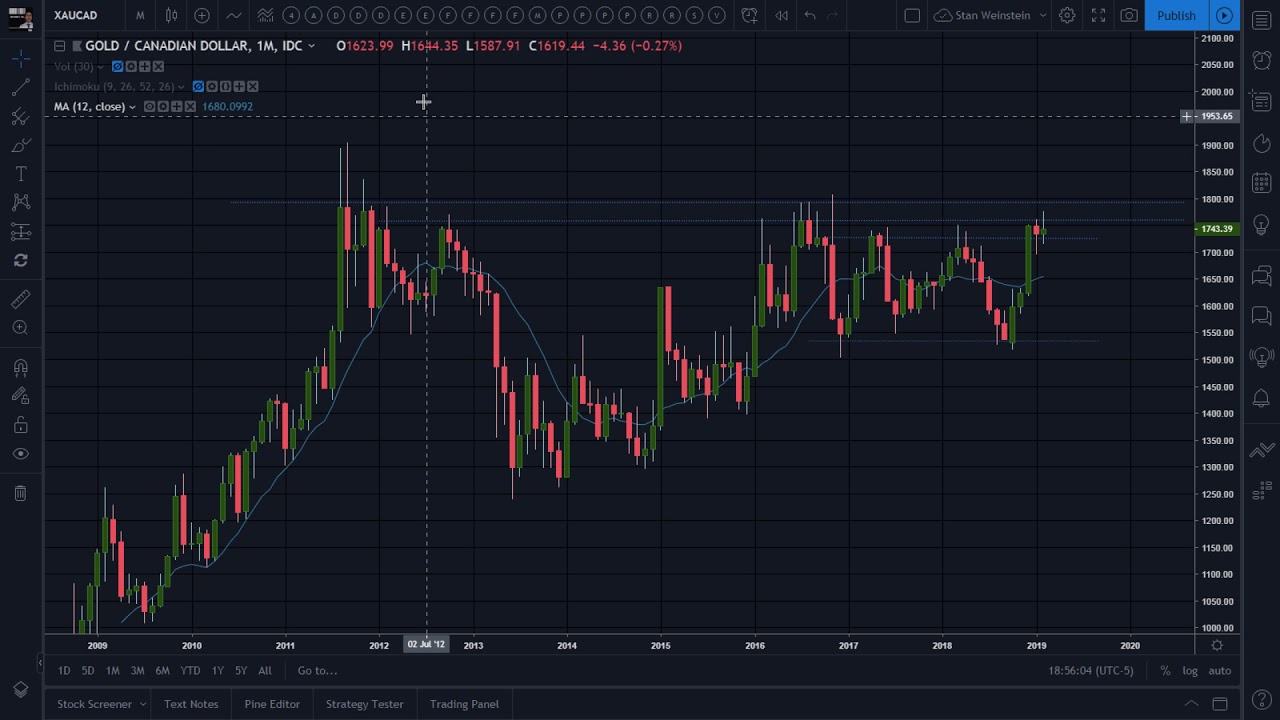
Secretwars #0398 – Markets Review: Gold in US & Canadian Dollars.
On April 2, 2019
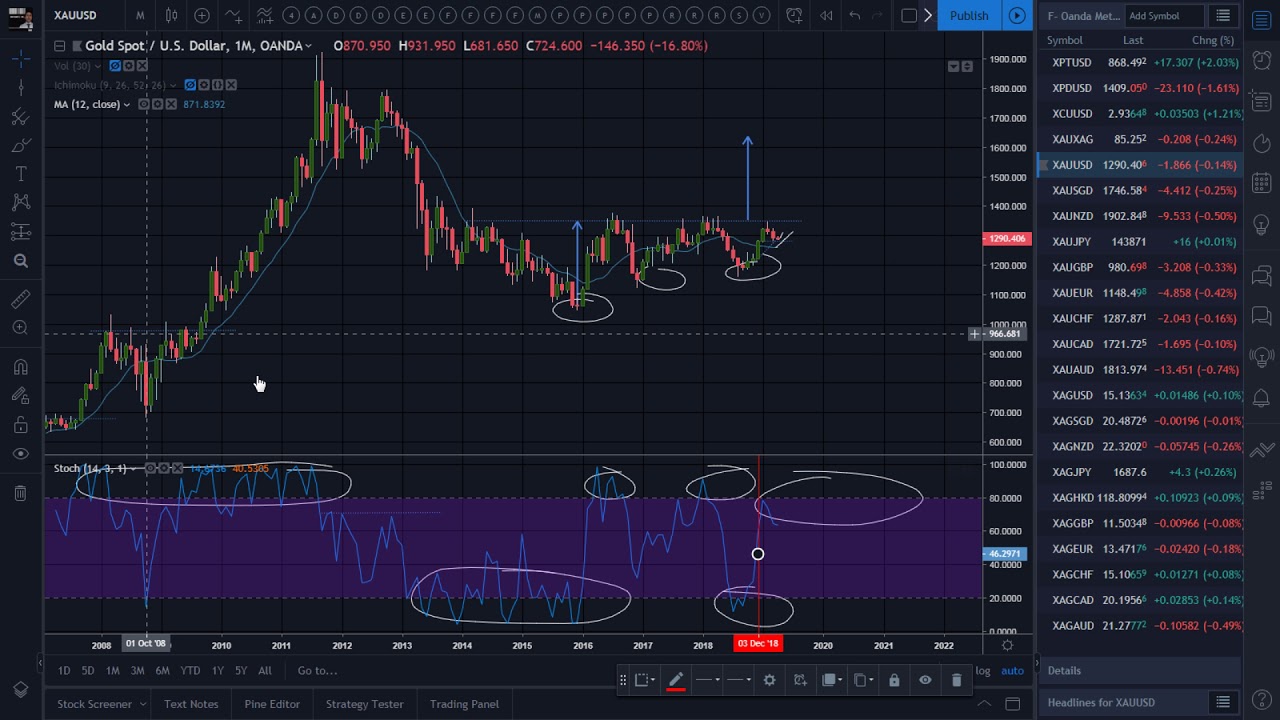
Secretwars #0397 – Markets Review: US & World Tour 2019!
On April 1, 2019
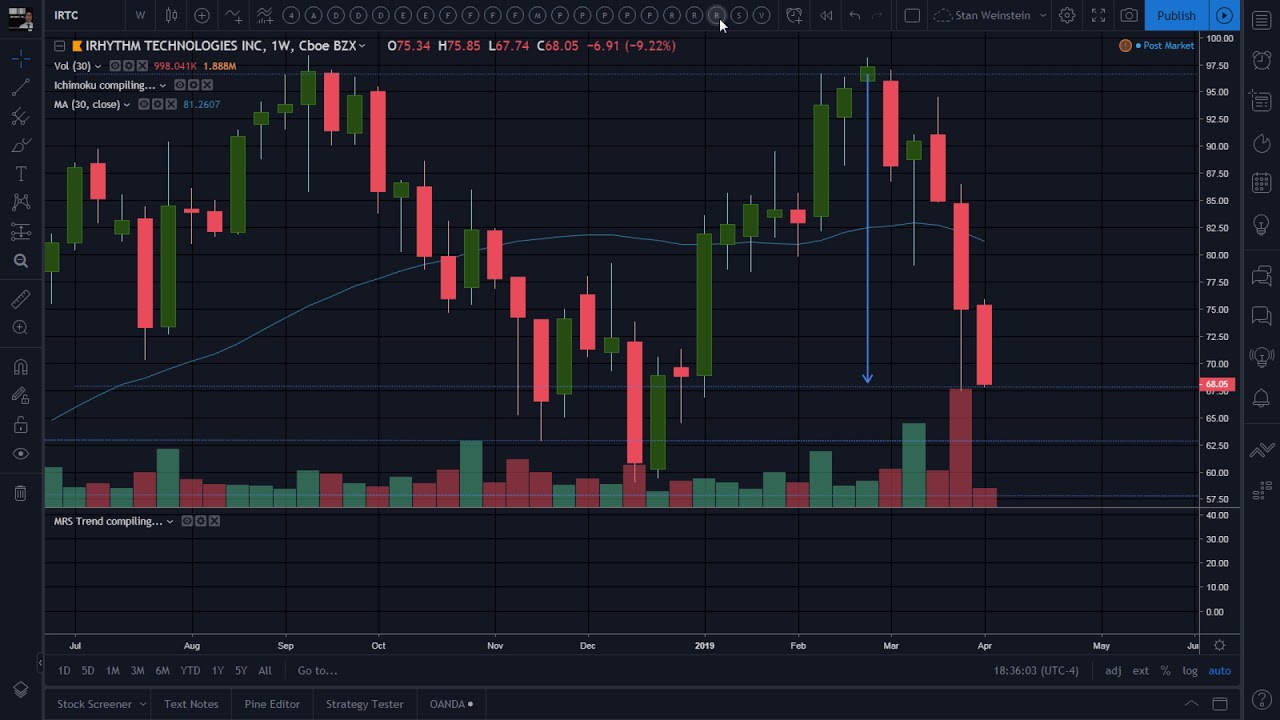
Secretwars #0396 – Picture perfect Stage 4 entry for Irhythm Technologies Inc.!
On March 31, 2019
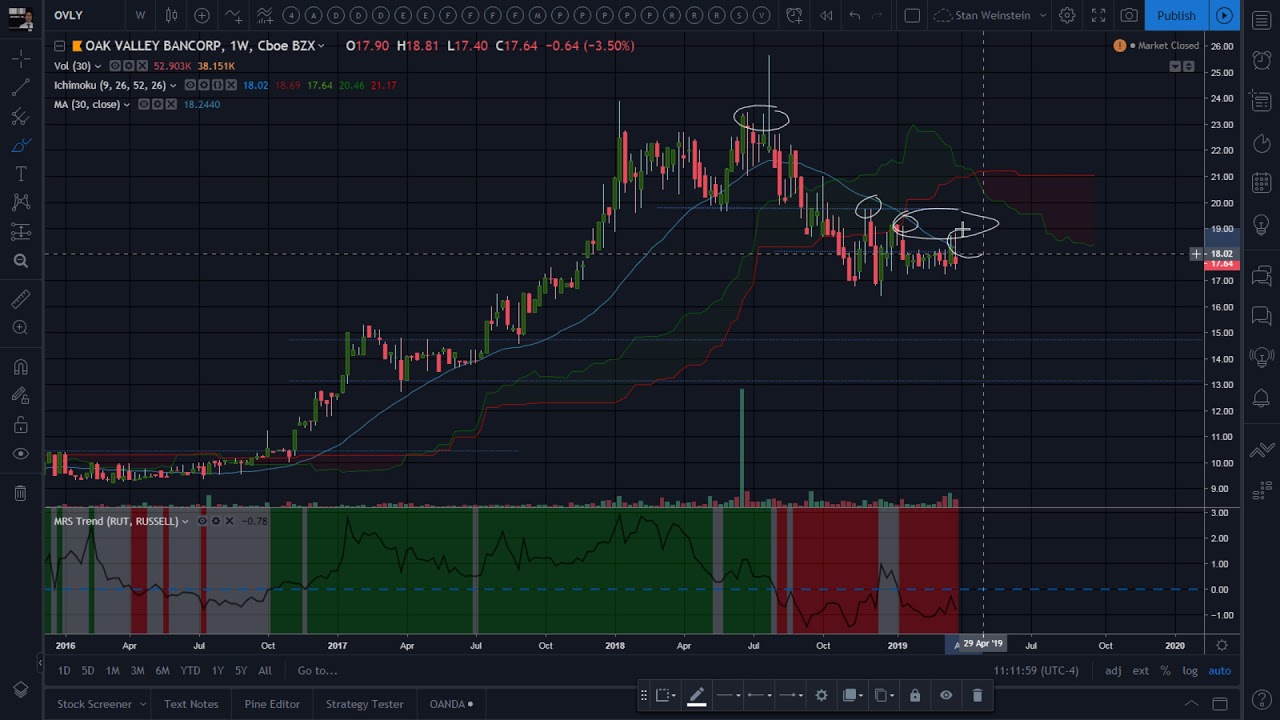
Secretwars #0395 – Oak Valley Bancorp ready to continue it’s Stage decline!
On March 31, 2019
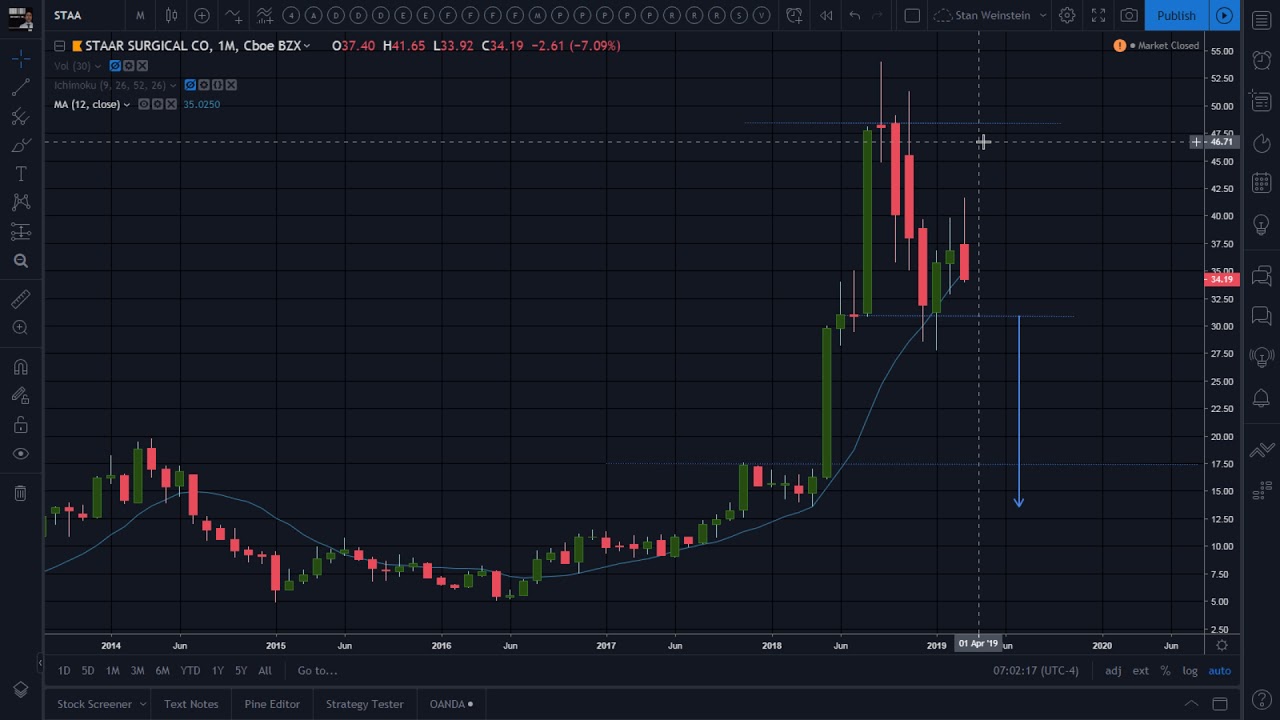
Secretwars #0394 – Staar Surgical Co. preparing to exit Stage 3.
On March 29, 2019
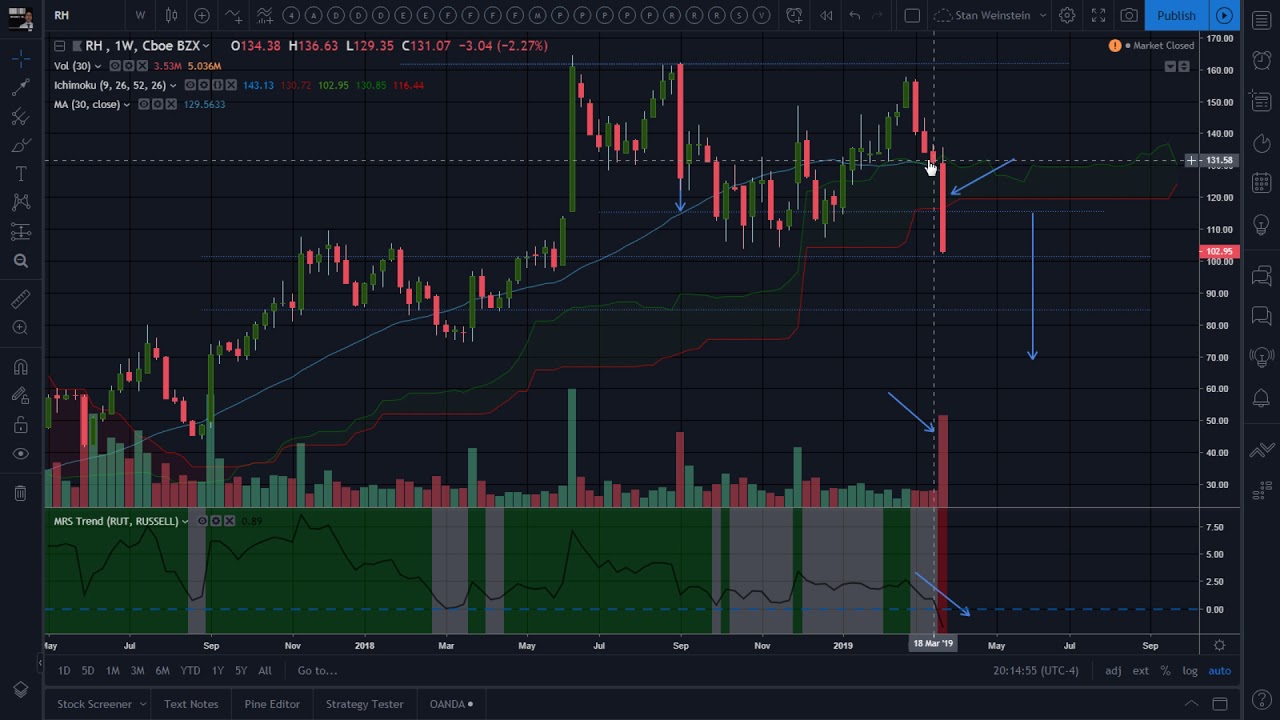
Secretwars #0393 – Restoration Hardware plunging in Stage 4 territory!
On March 28, 2019
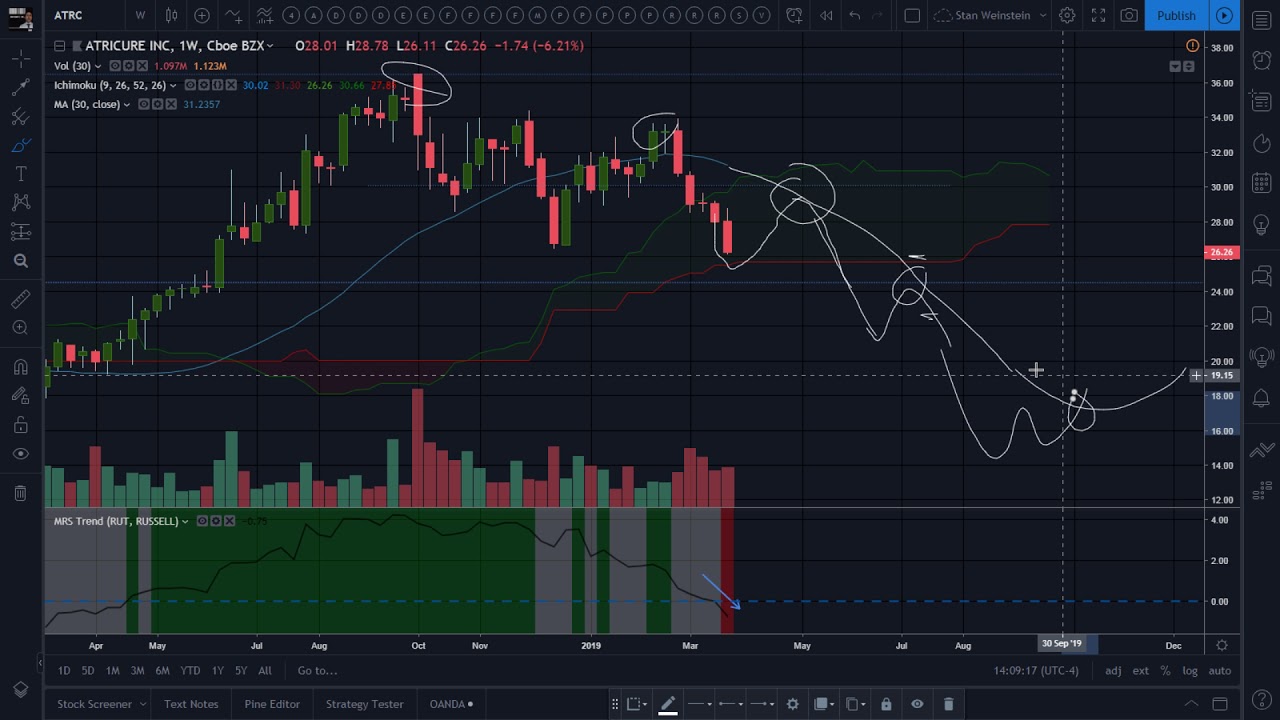
Secretwars #0392 – Atricure Inc., embryonic Stage 4 in progress.
On March 27, 2019
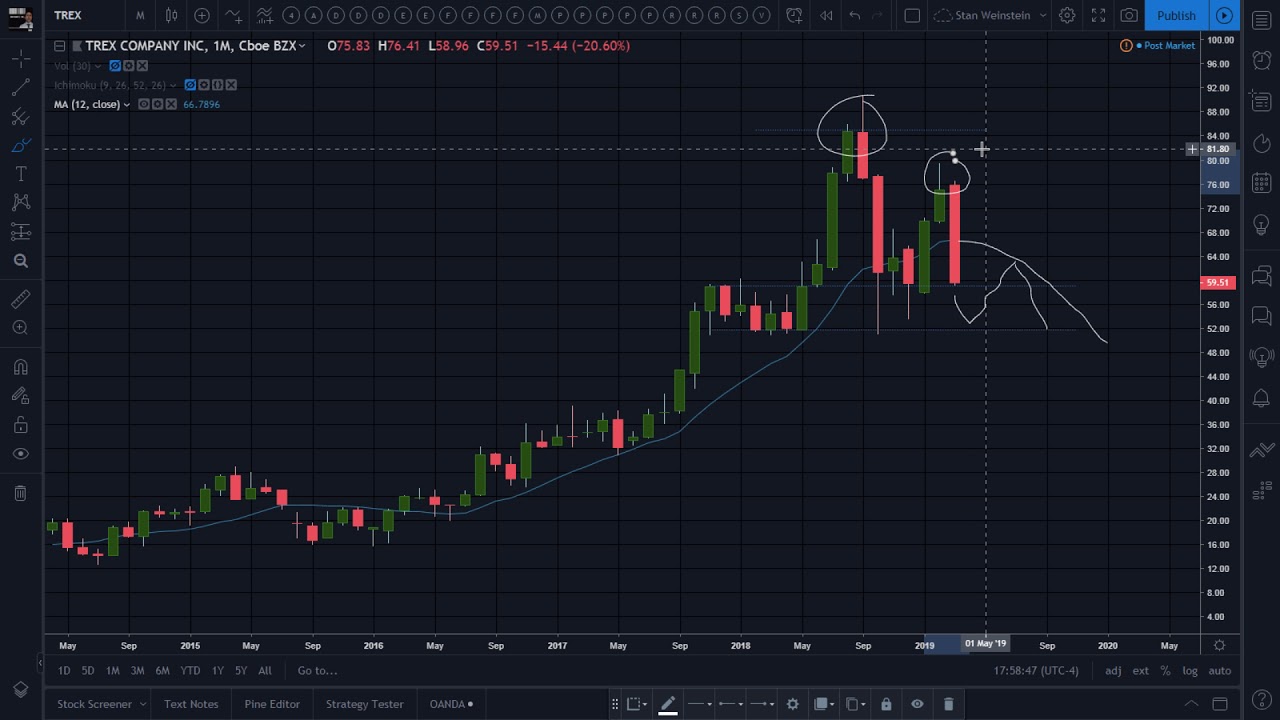
Secretwars #0391 – Trex Company Inc. preparing for Stage 4 slide…
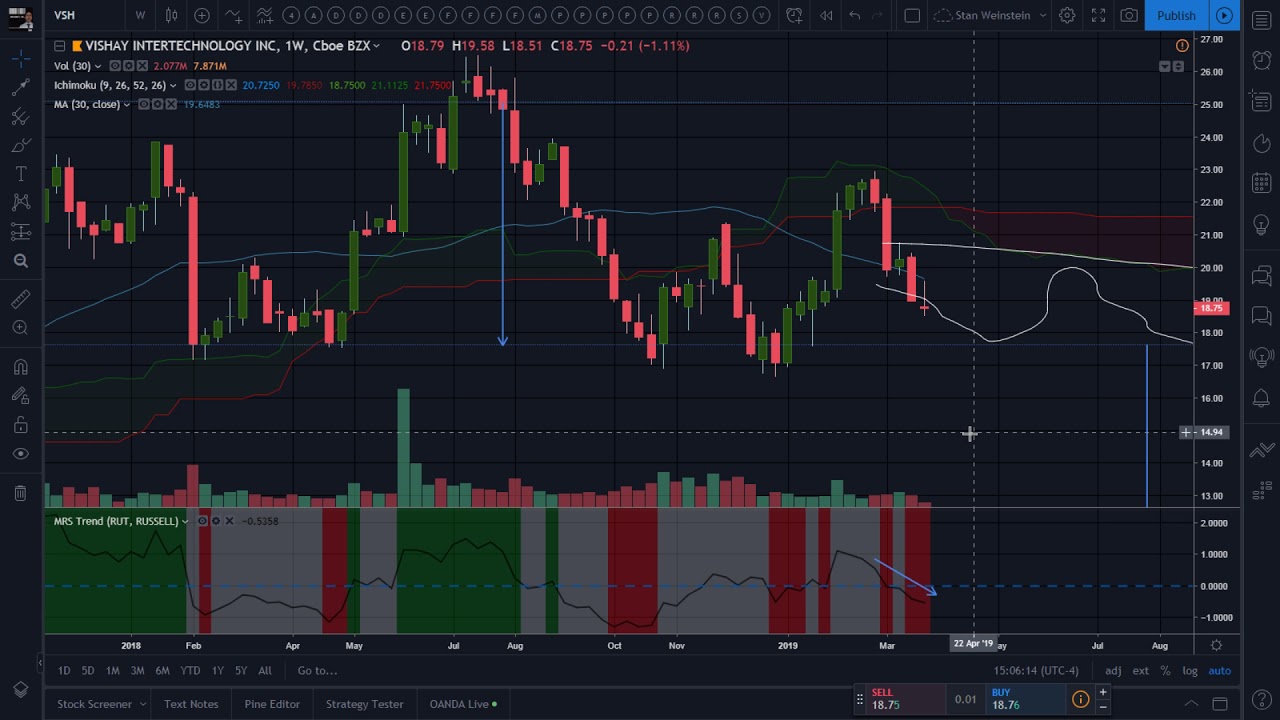
On March 26, 2019
Secretwars #0390 – Vishay Intertechnology Inc. about to slide in the abyss!
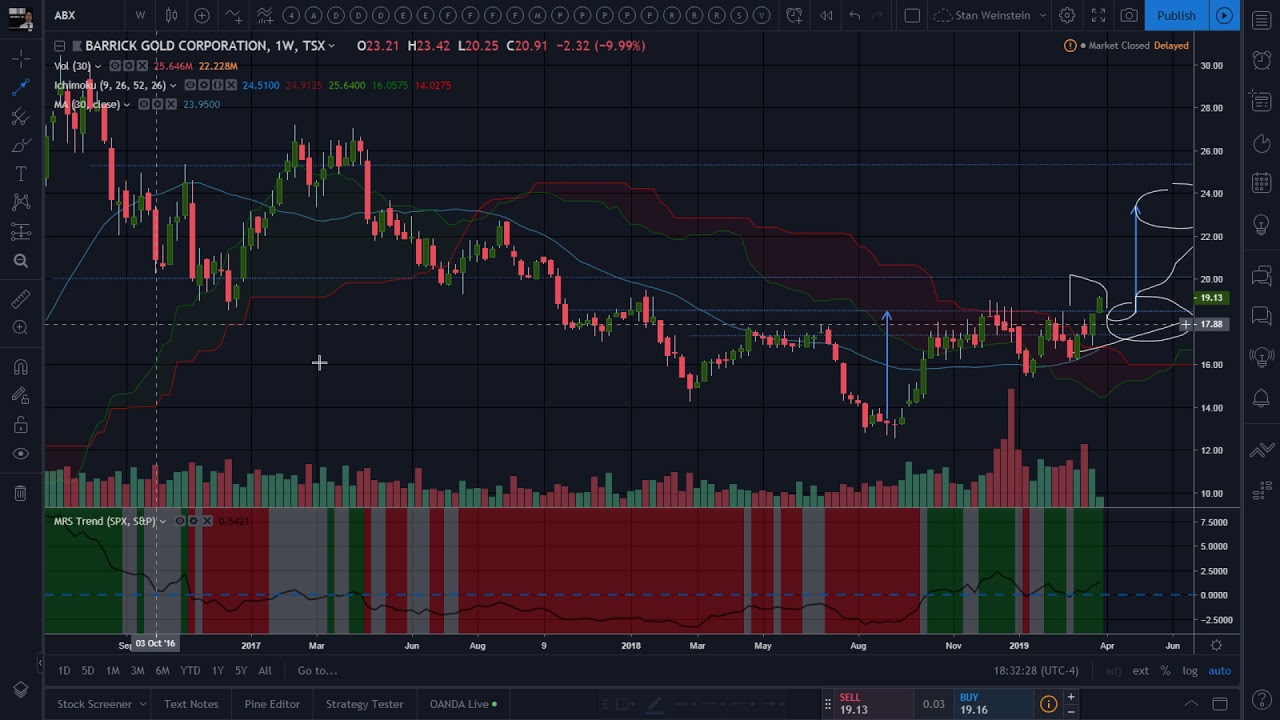
On March 25, 2019
Secretwars #0389 – Barrick Gold Corporation on brink of Stage 2 explosion!
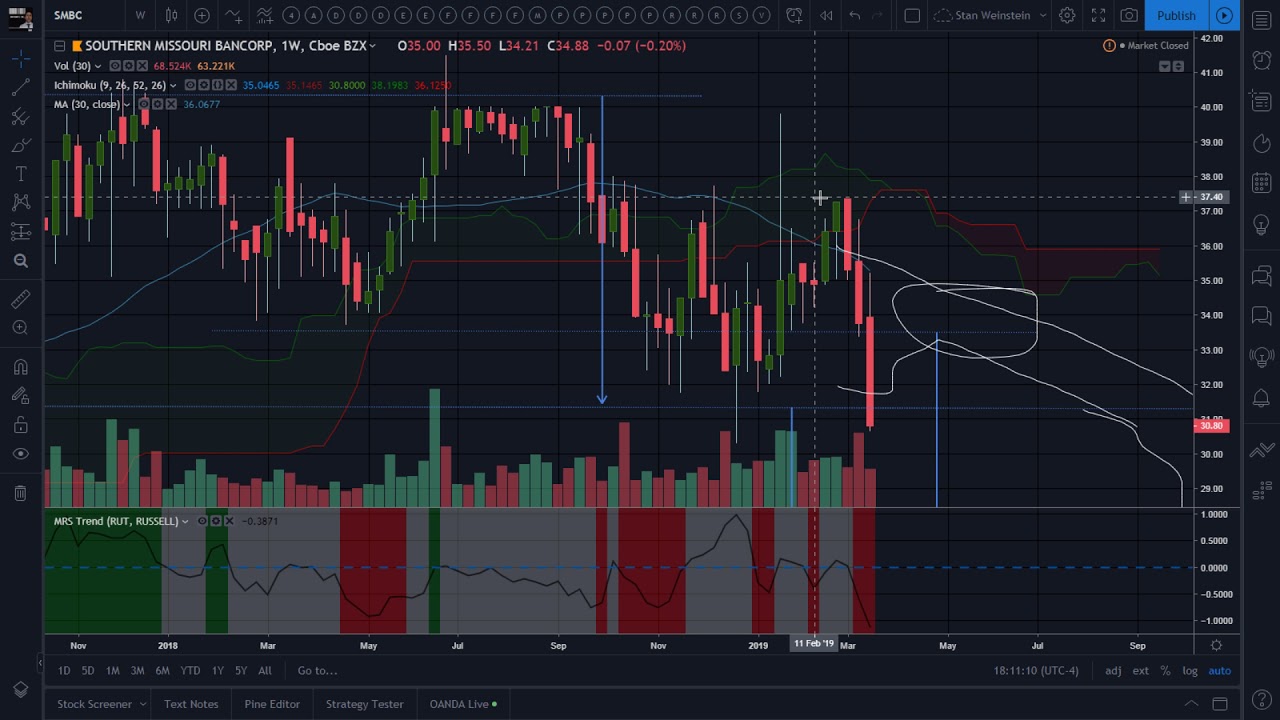
On March 24, 2019
Secretwars #0388 – Southern Missouri Bancorp breaking down!
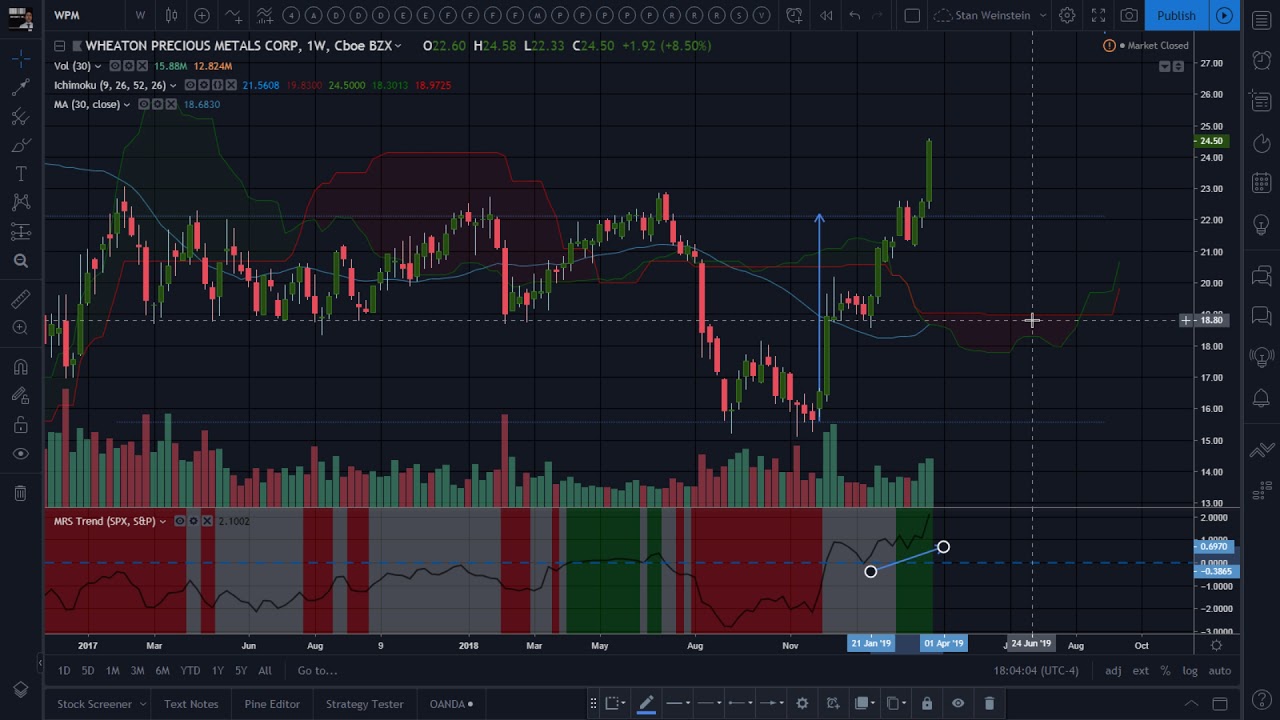
On March 23, 2019
Secretwars #0387 – Revisiting Wheaton Precious Metals, getting some shine back!
On March 22, 2019
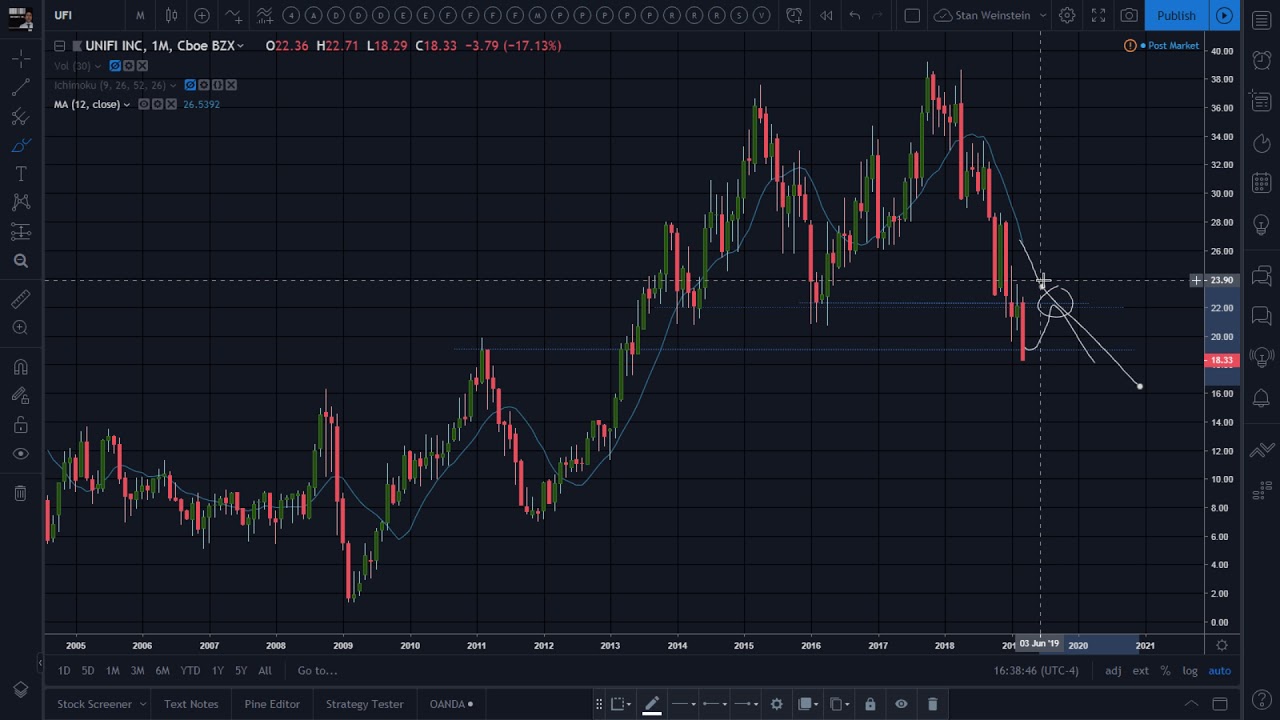
Secretwars #0386 – How much bleeding can Unifi Inc. endure?
On March 21, 2019
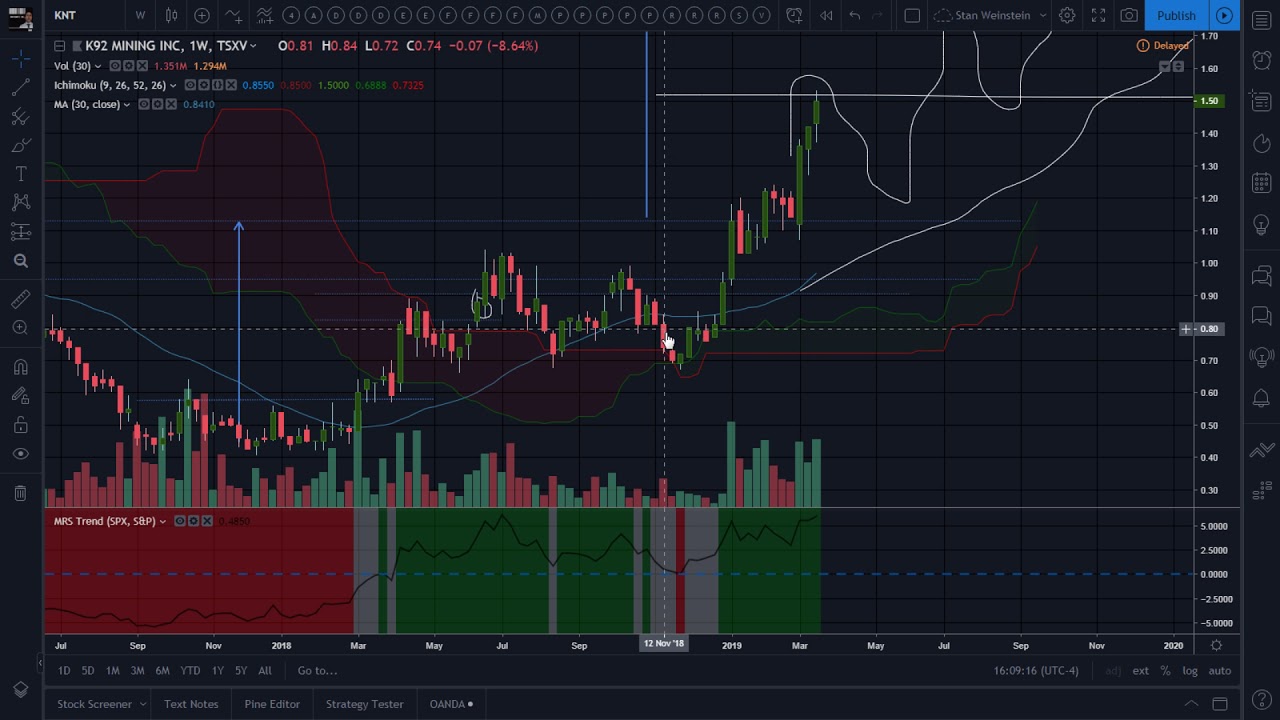
Secretwars #0385 – Revisiting K92 Mining Inc., advancing it’s Stage 2 incline.
On March 20, 2019
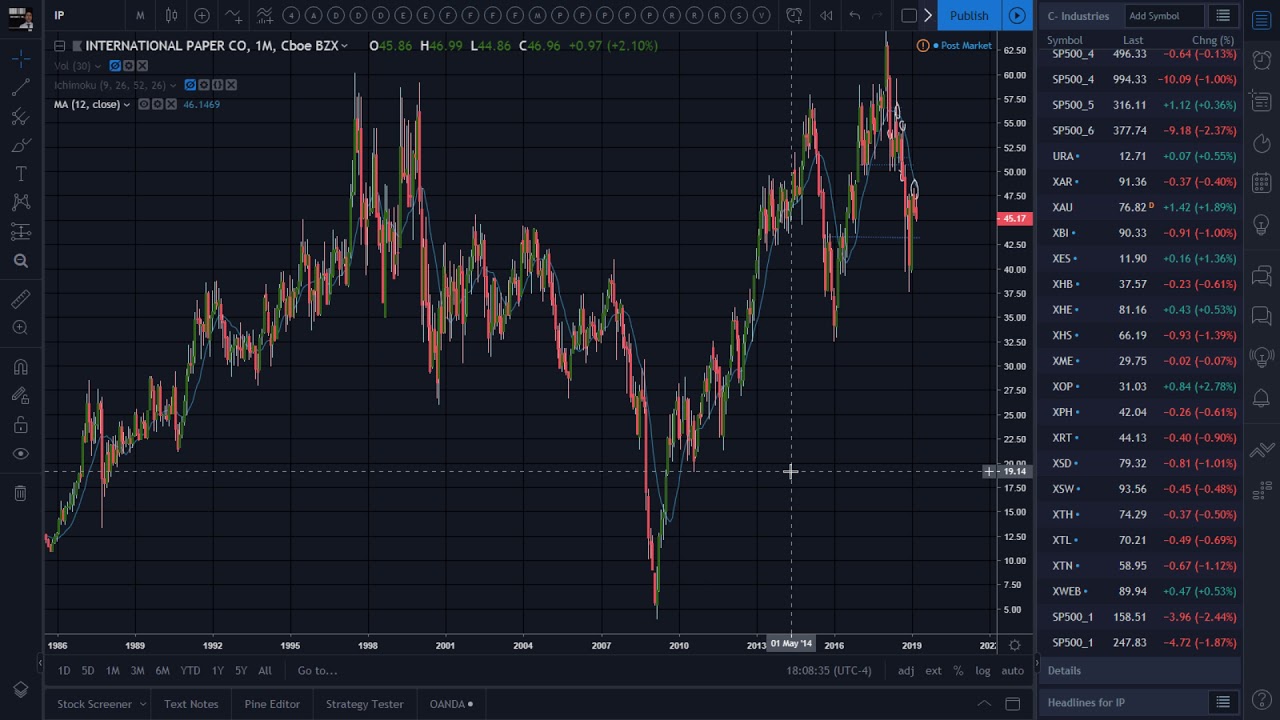
Secretwars #0384 – Stage 4 continuation breakdown for International Paper Co.!
On March 19, 2019
Secretwars #0383 – Prey of the day, Covenant Transportation Group Inc.!
On March 18, 2019
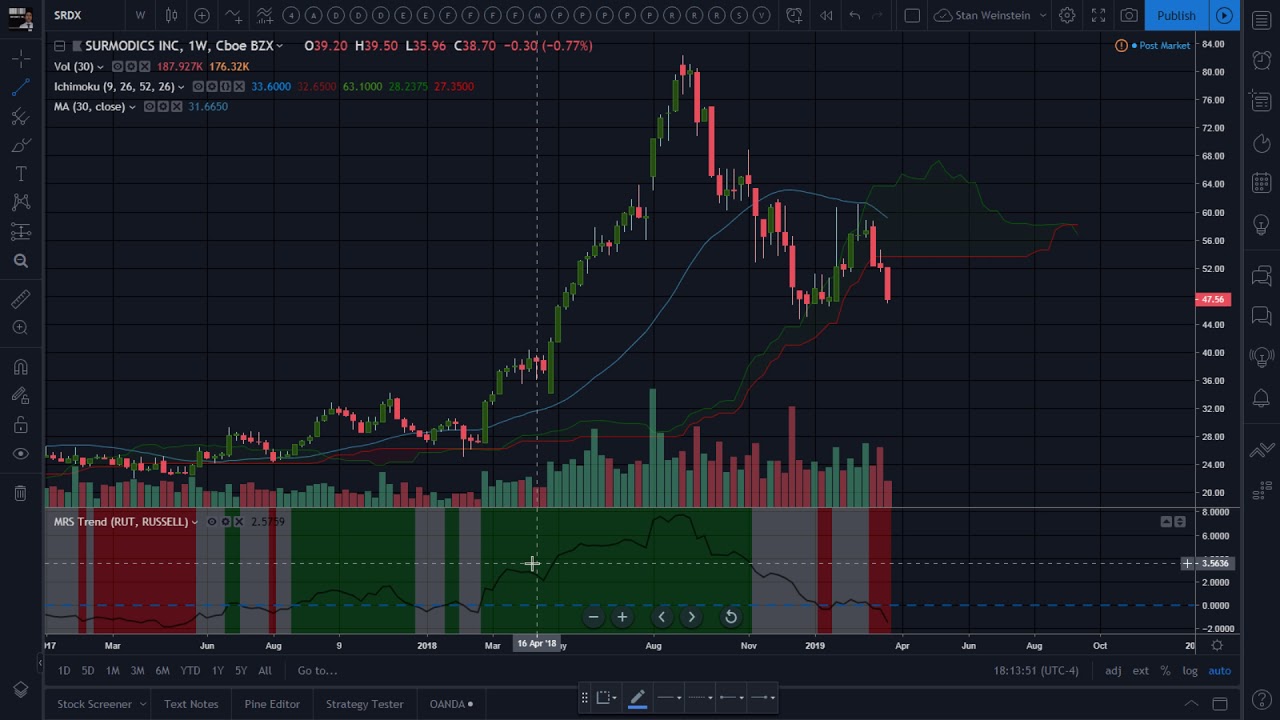
Secretwars #0382 – Targeting a weak Surmodics Inc. as a potentiel short!
On March 17, 2019
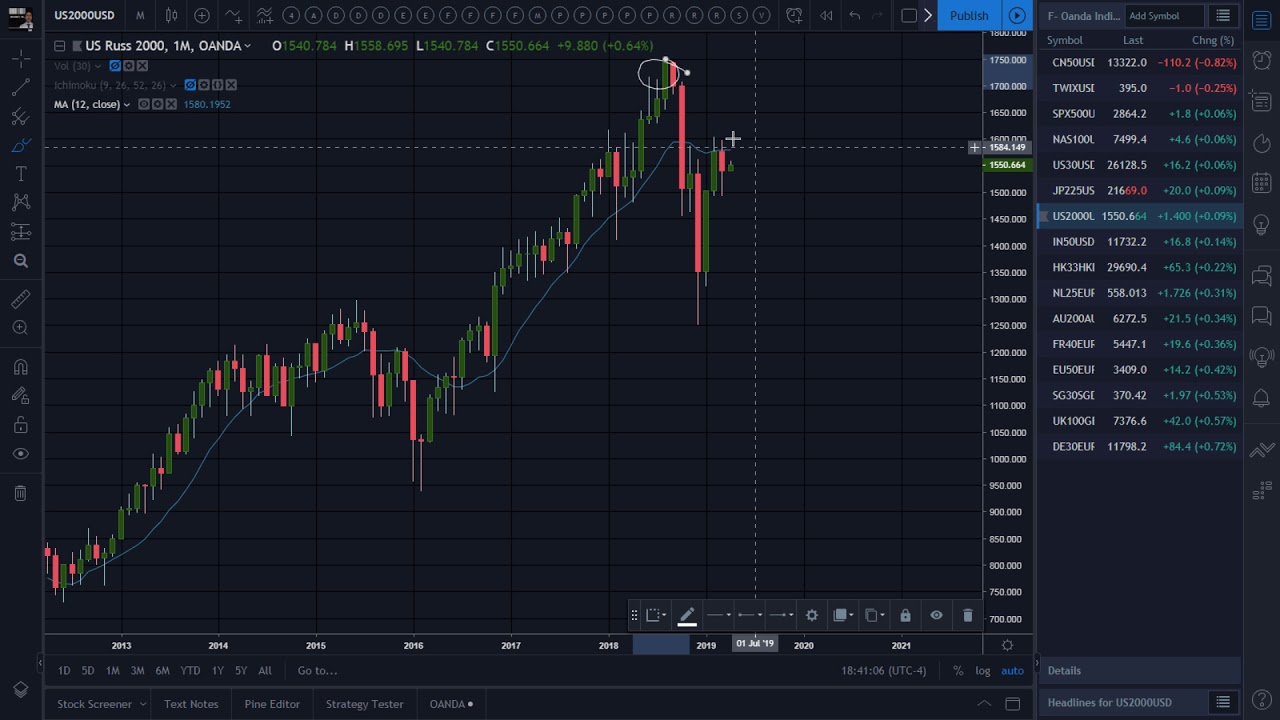
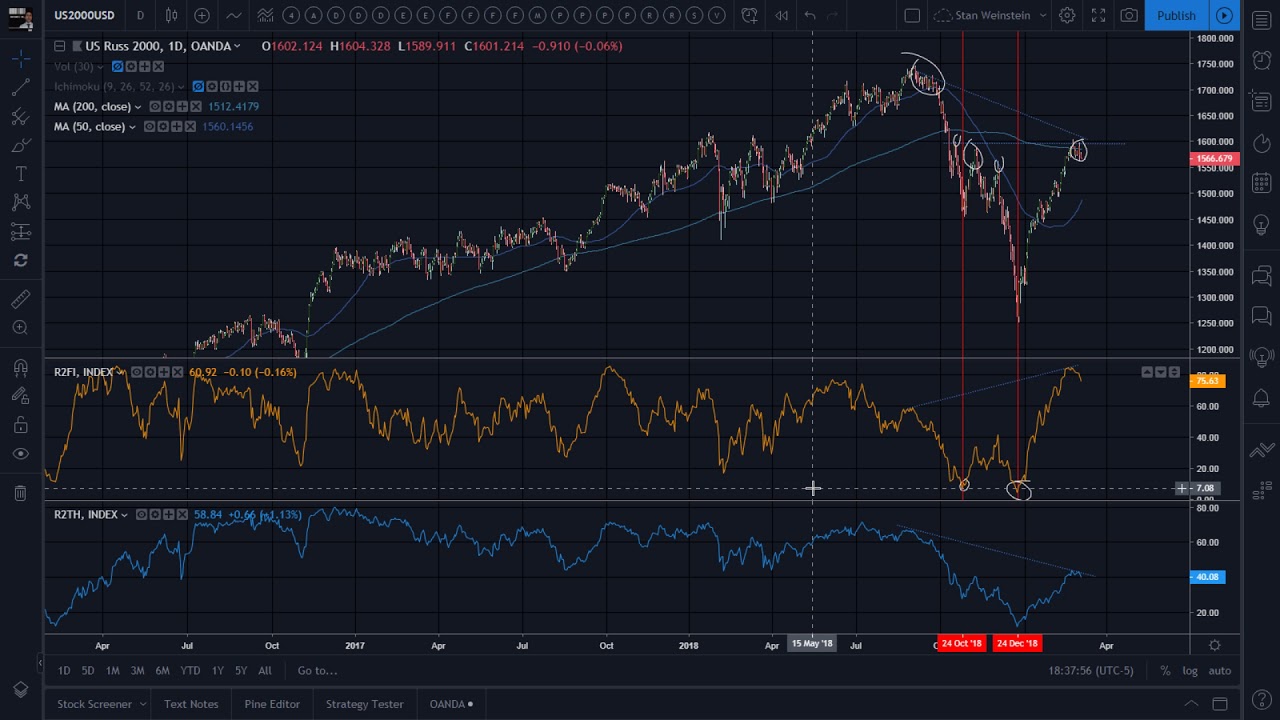
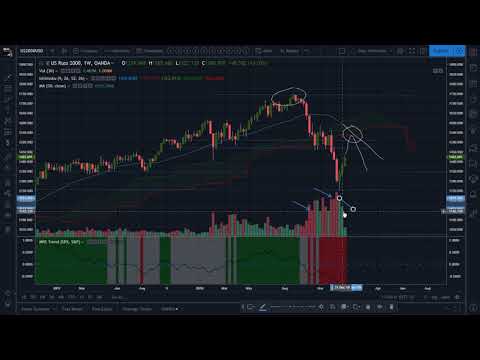
Secretwars #0381 – Markets Review: Why I decided to prey on Russel 2000 stocks!
On March 16, 2019
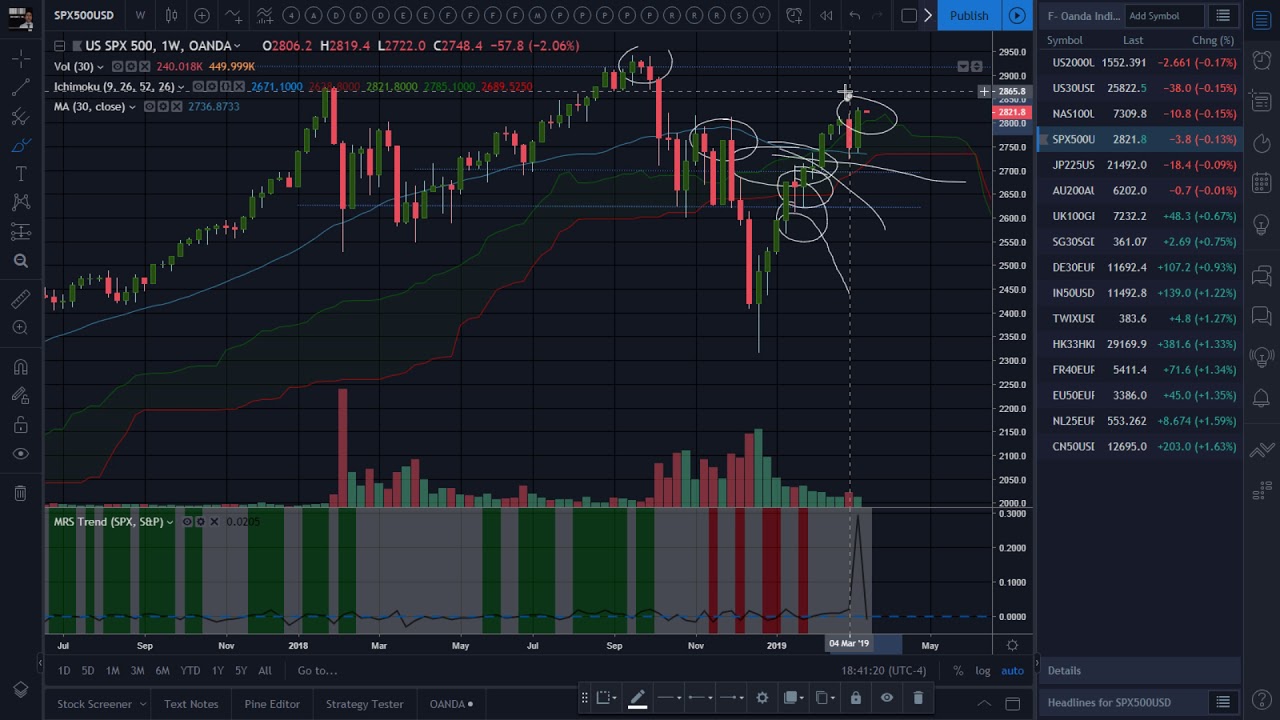
Secretwars #0380 – Markets Review: Reversal of fortune for Semiconductors?
On March 15, 2019
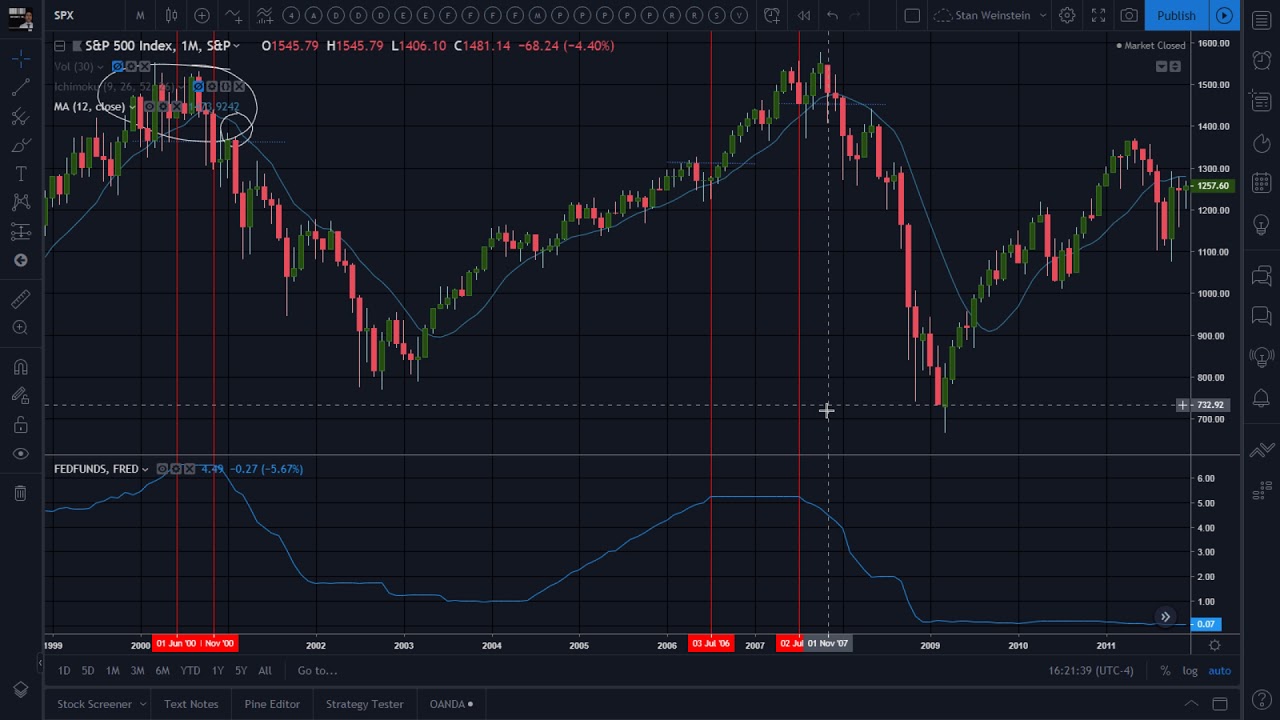
Secretwars #0379 – Markets Review: Using the Fed fund rate as a crystal ball!
On March 14, 2019
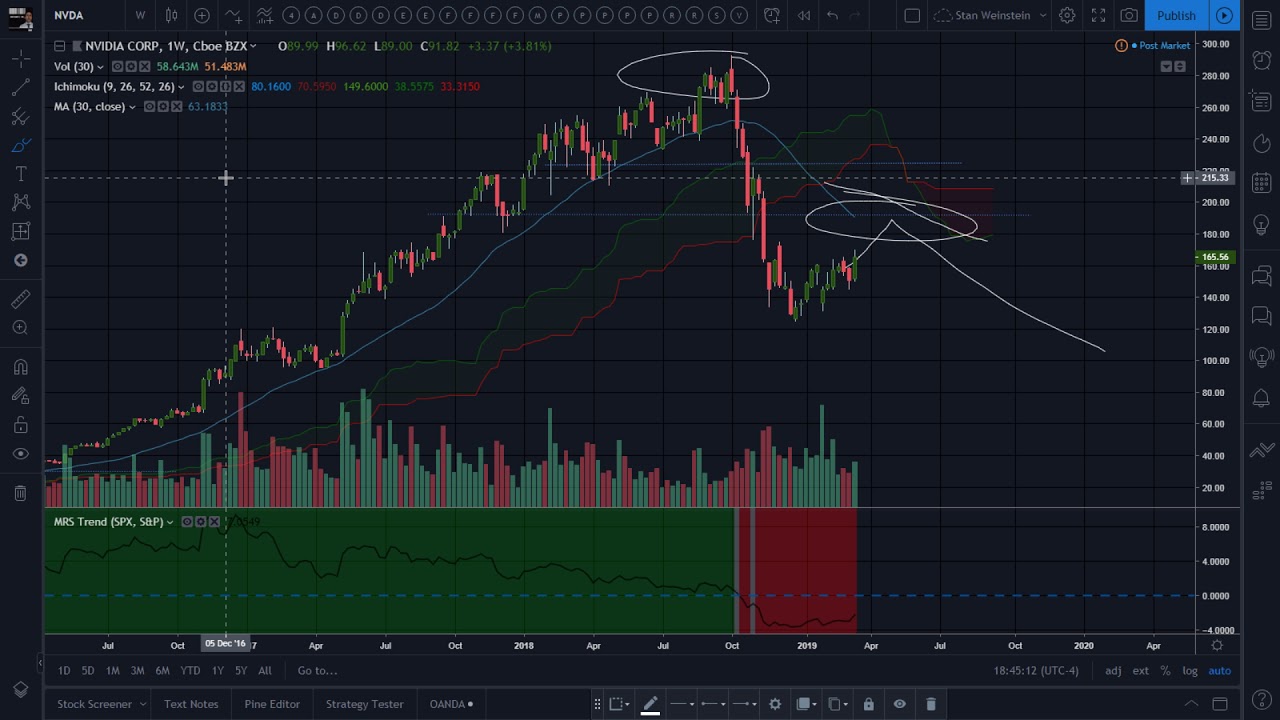
Secretwars #0378 – Revisiting Nvidia, with a possible Stage 4 continuation breakdown.
On March 13, 2019
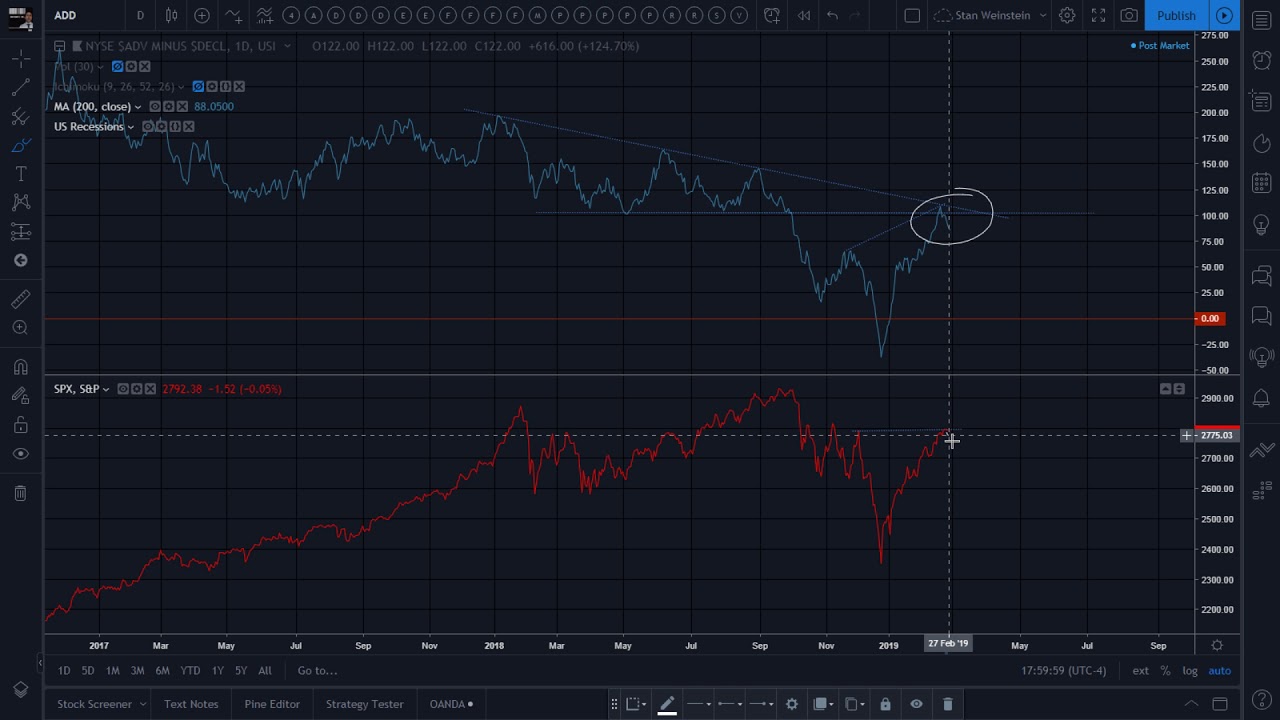
Secretwars #0377 – Markets Review: What is the NYSE Advance-Decline telling me?
On March 12, 2019
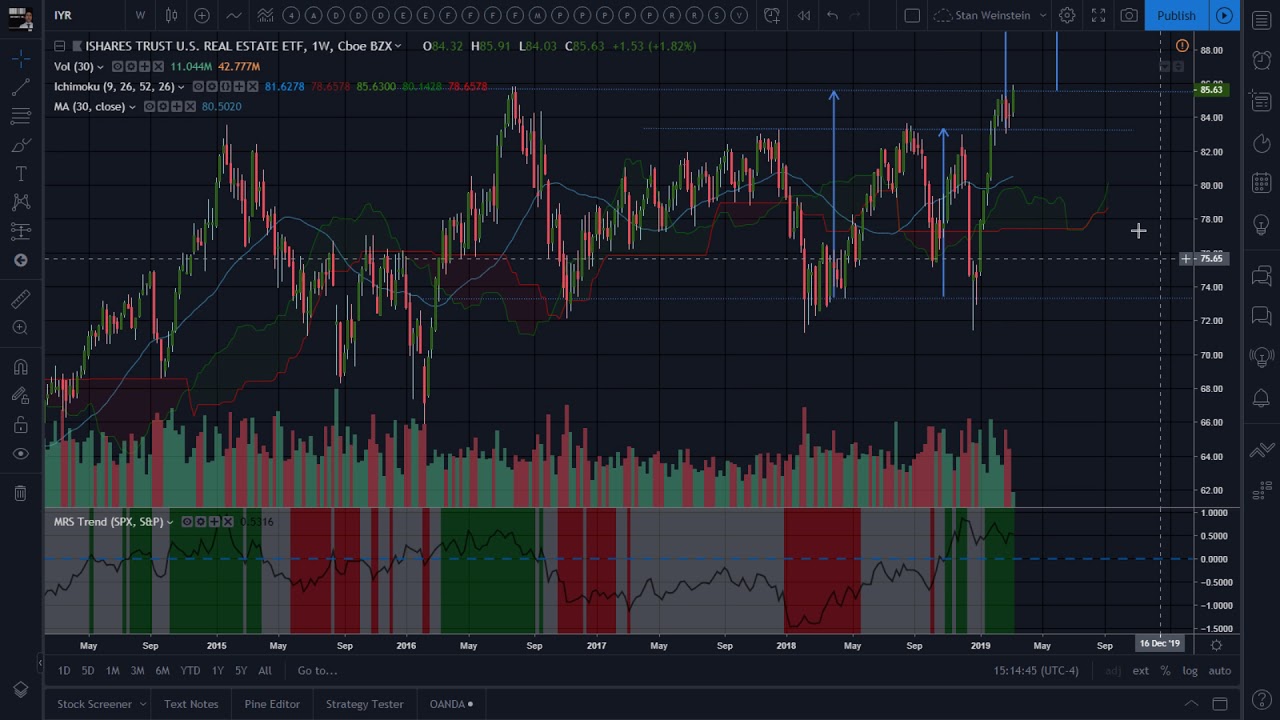
Secretwars #0376 – Markets Review: Ishares Trust U.S. Real Estate ETF.
On March 11, 2019
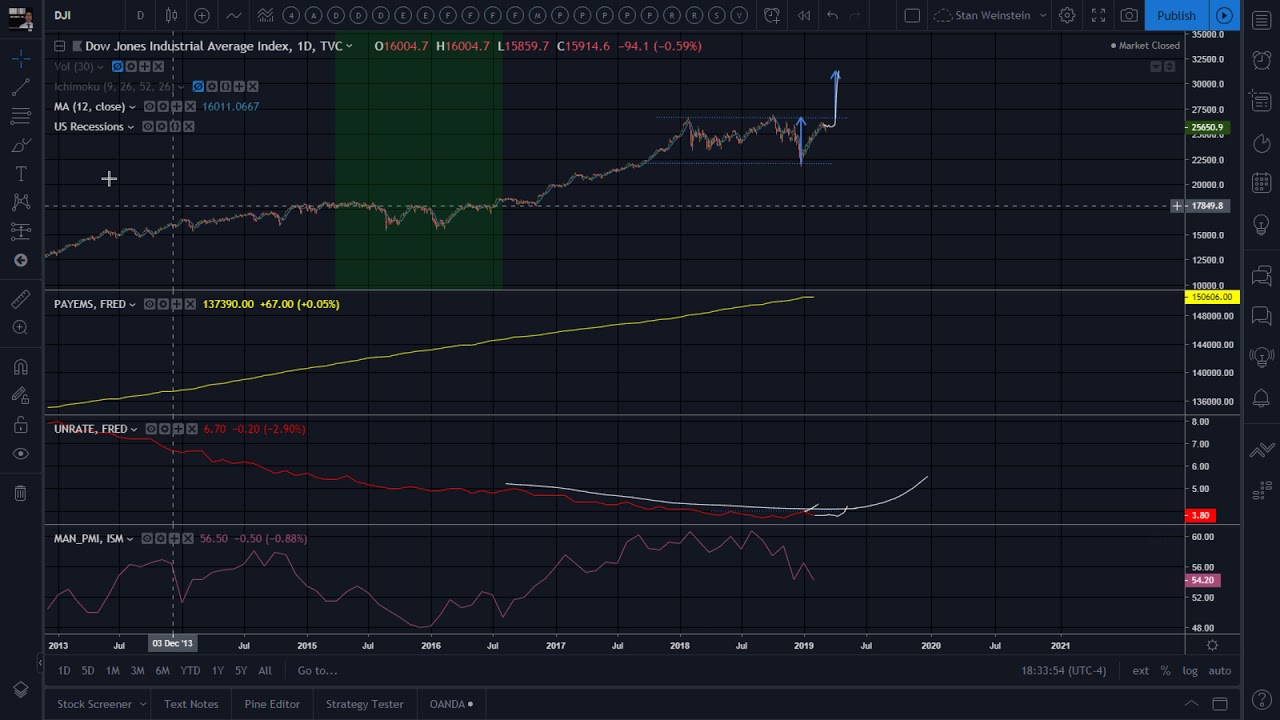
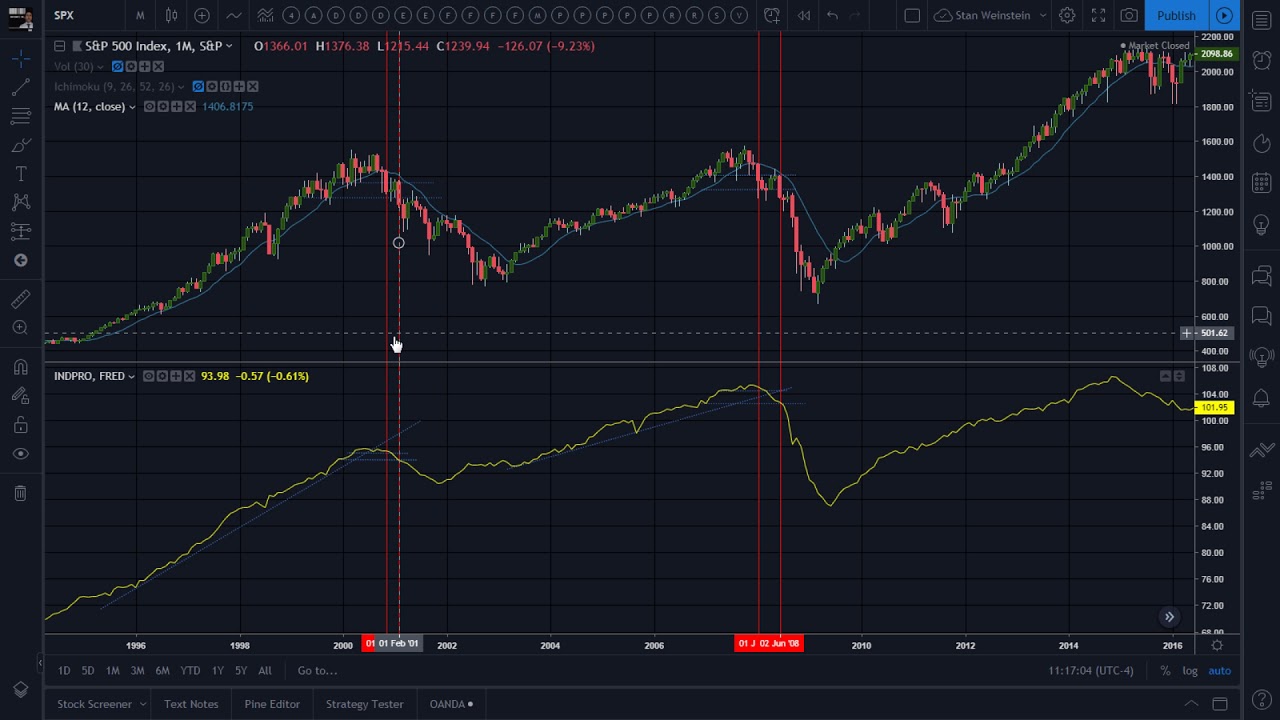
Secretwars #0375 – Markets Review: About that Economic Data and Business Cycle…
On March 10, 2019
Secretwars #0374 – Markets Review: The Industrial Production Index.
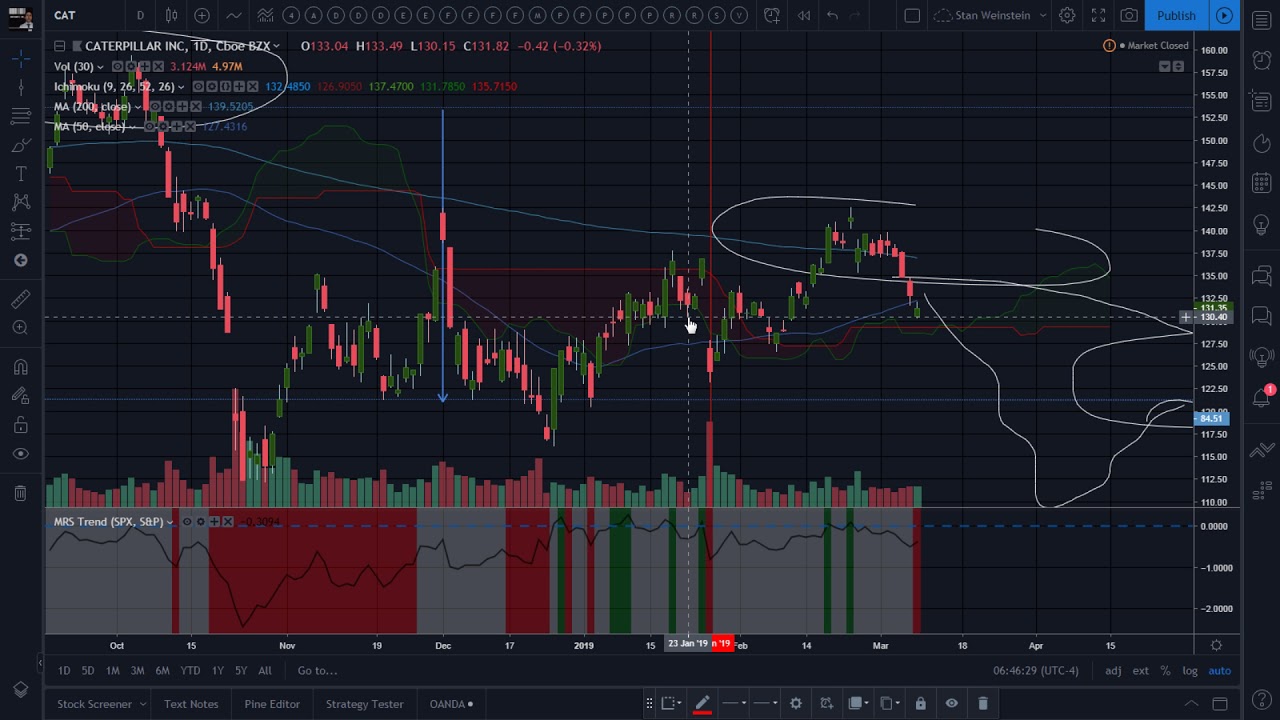
On March 10, 2019
Secretwars #0373 – Revisting Caterpillar Inc. resuming it’s Stage 4 slide!
On March 9, 2019
Secretwars #0372 – Markets Review: S&P sectors “health check”.
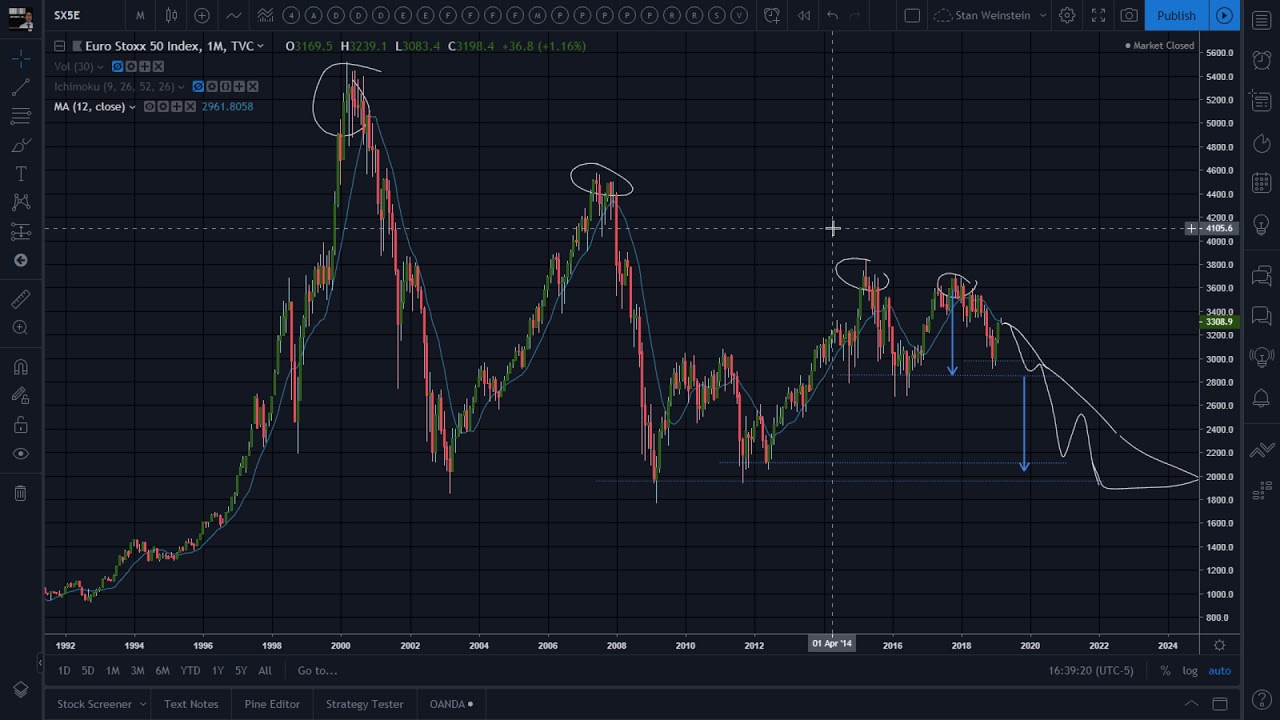
On March 7, 2019
Secretwars #0371 – Markets Review: A fast look at Euro Stoxx 50 Index.
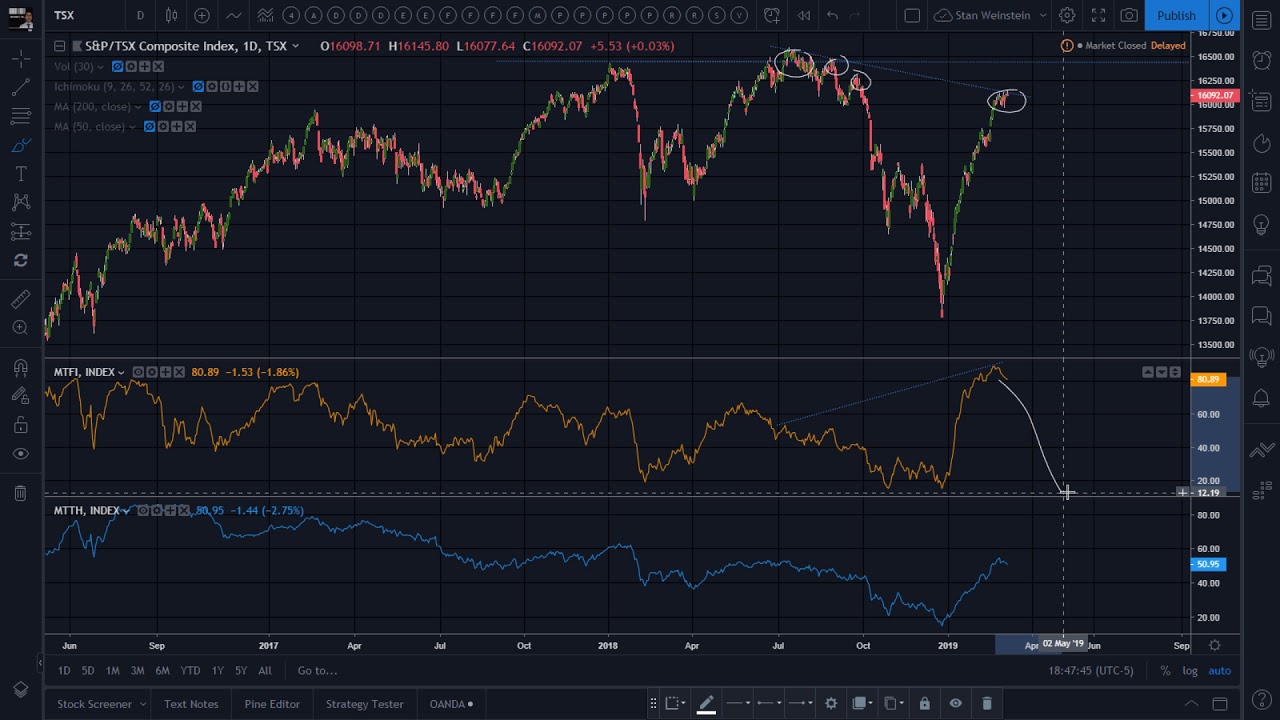
On March 6, 2019
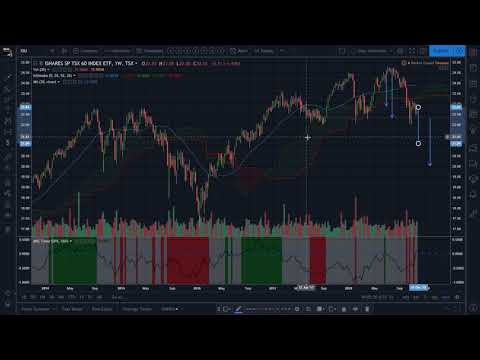
Secretwars #0370 – Markets Review: TSX Composite Index… Oh Canada!!!
On March 5, 2019
Secretwars #0369 – Markets Review: Russel 2000, the weakest of US markets!
On March 4, 2019
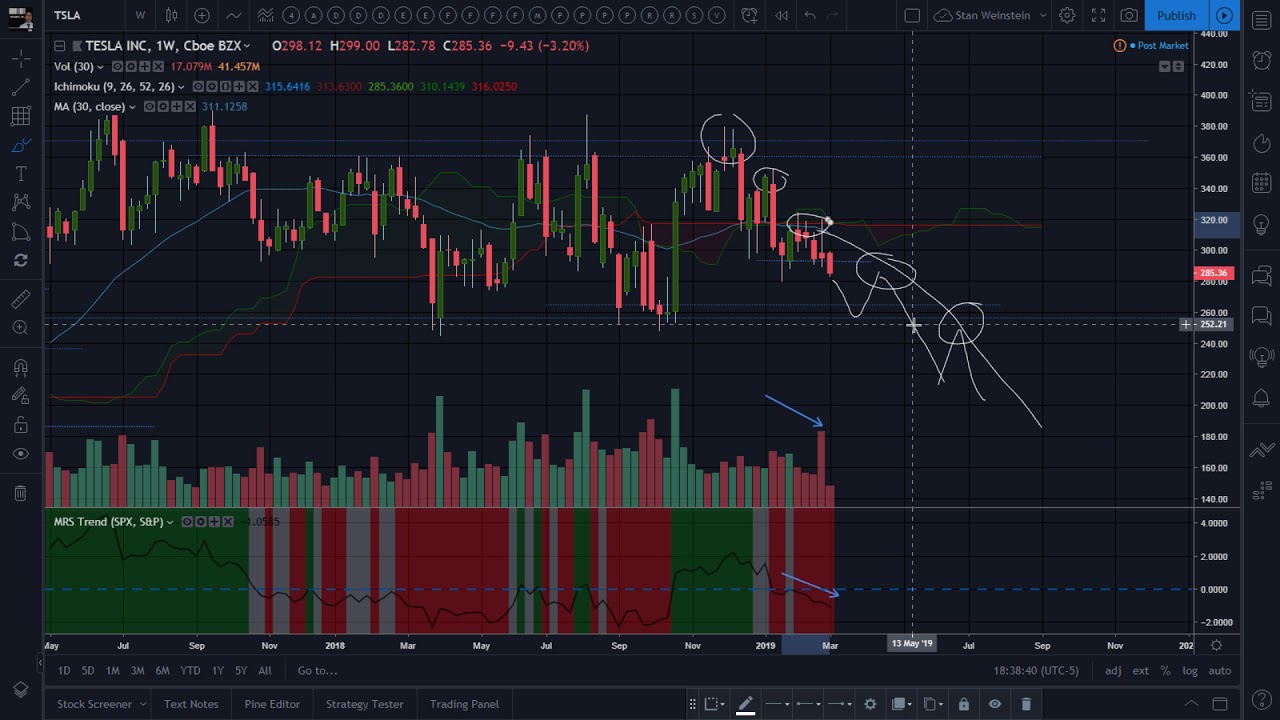
Secretwars #0368 – Tesla, now back in Stage 4… but for how long?
On March 3, 2019
Secretwars #0367 – Markets Review: Why I’m bearish on US Markets!
On March 2, 2019
Secretwars #0366 – Markets Review: Investment Grade Corporate Bond diverging with S&P 500!
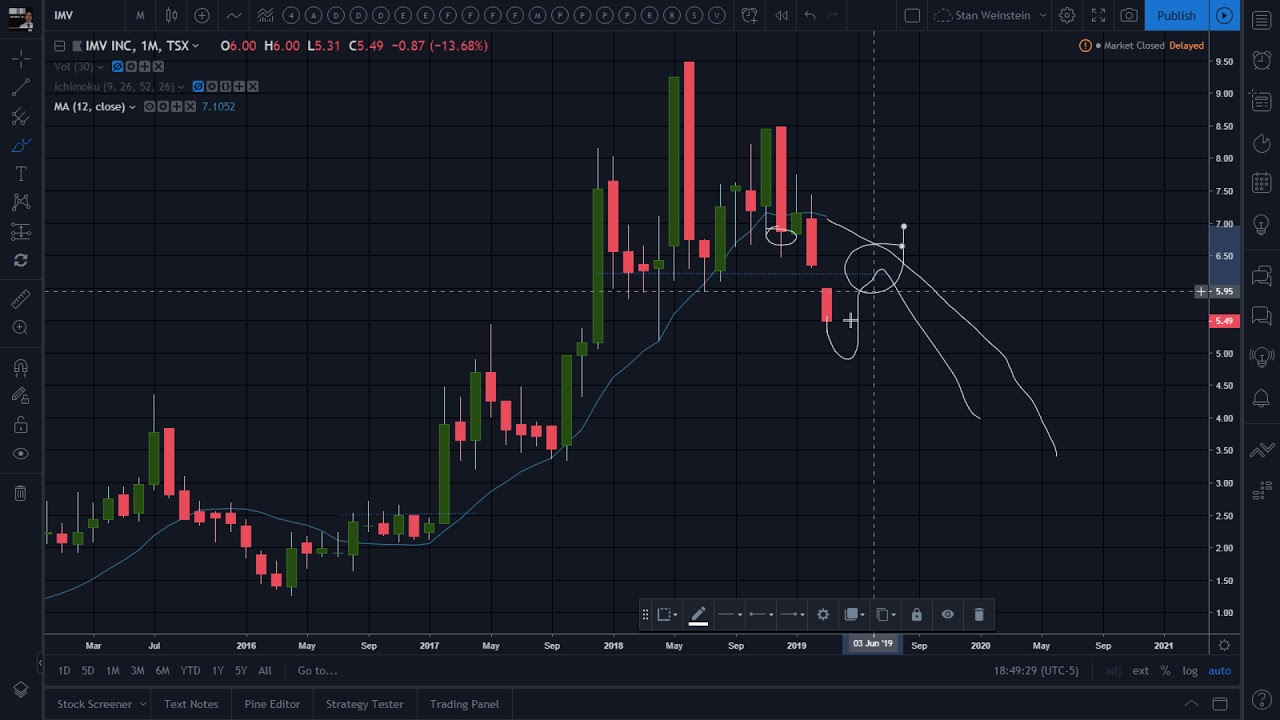
On March 1, 2019
Secretwars #0365 – Fast look at IMV Inc.’s breakdown!
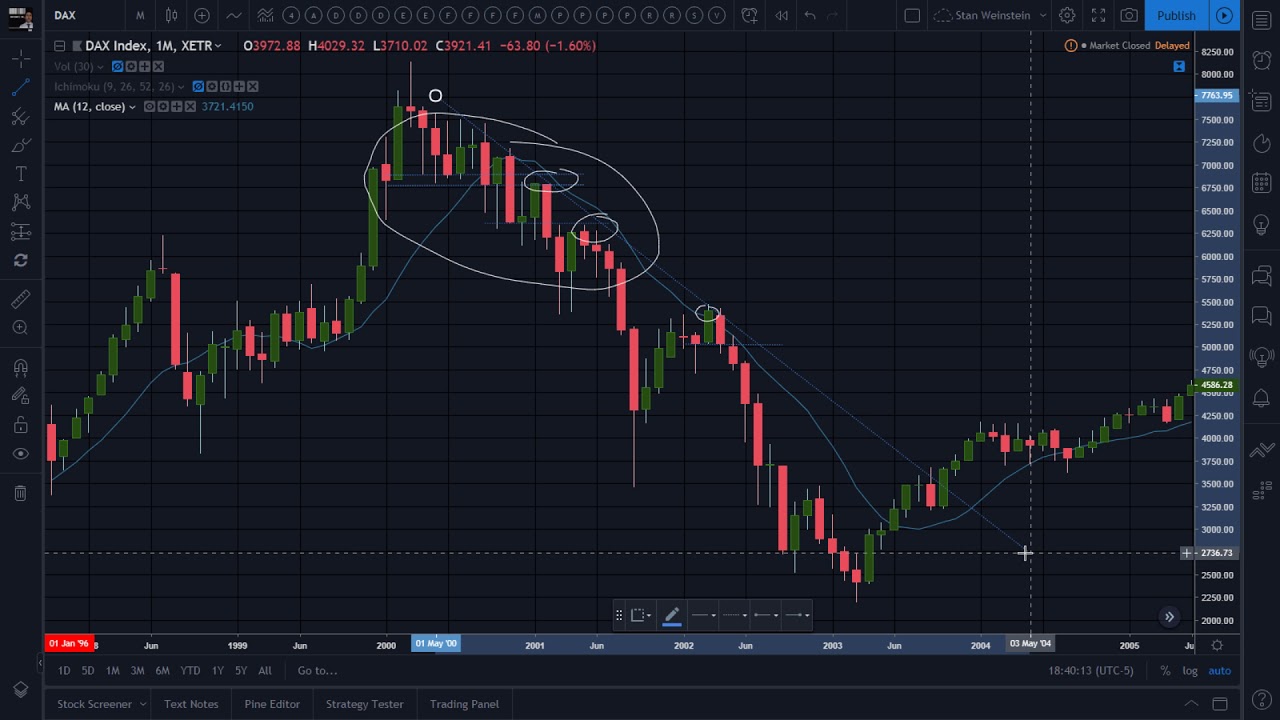
On February 28, 2019
Secretwars #0364 – Markets Review: Using the DAX to do some revisionist history.
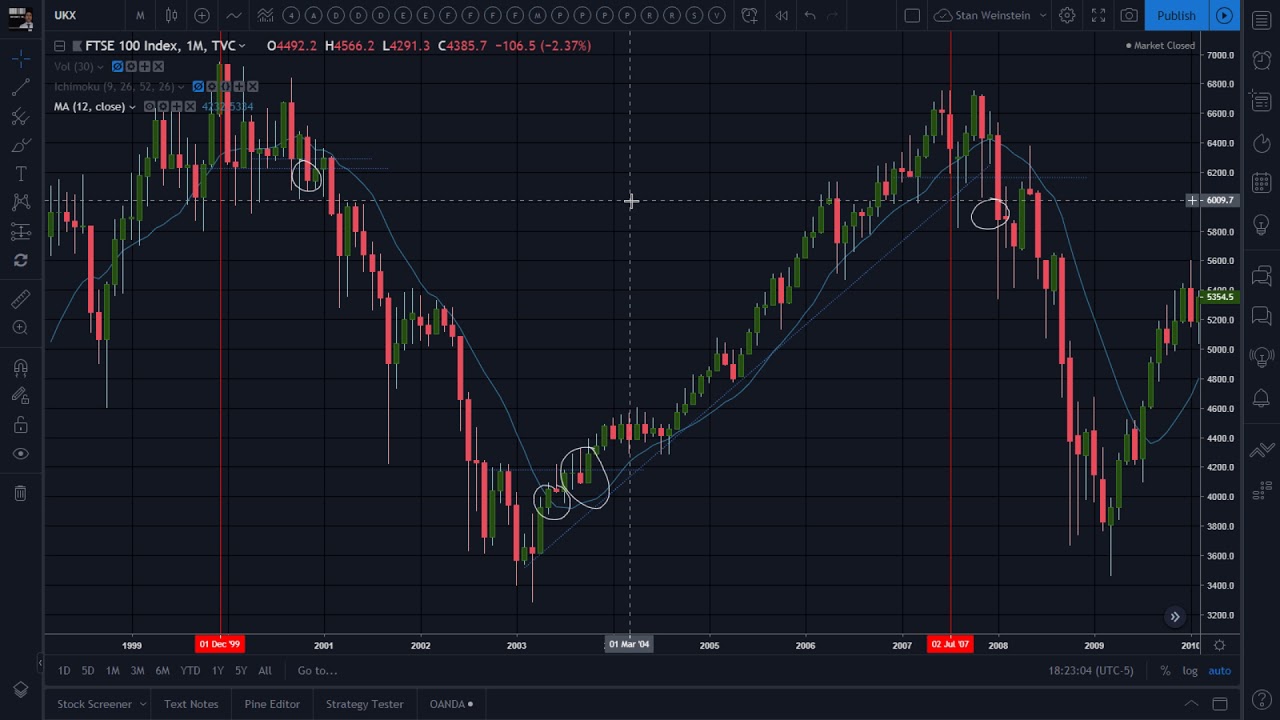
On February 27, 2019
Secretwars #0363 – Markets Review: Revisiting the still declining FTSE!
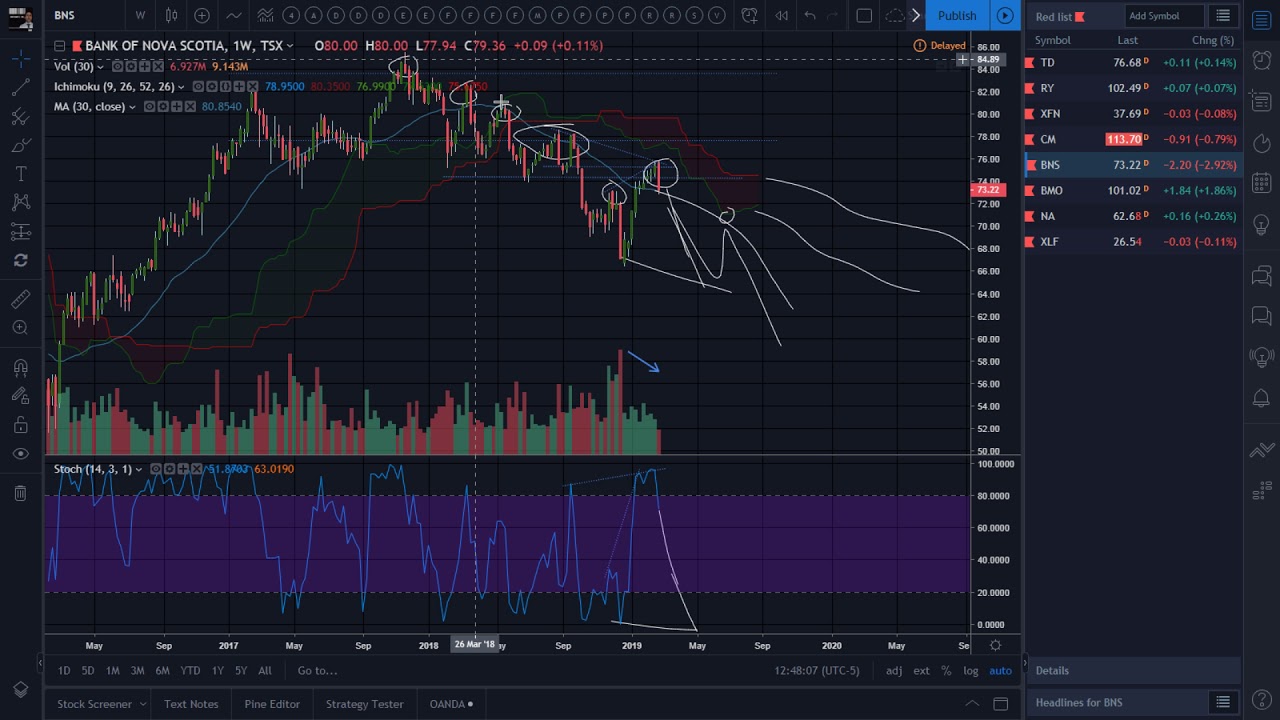
On February 26, 2019
Secretwars #0362 – Revisiting Bank of Nova Scotia, now rolling back in a Stage 4?
On February 25, 2019
Secretwars #0361 – Markets Review: Platinum US Dollars starting to turn around…
On February 24, 2019
Secretwars #0360 – Markets Review: Gold in Canadian Dollar poised to explosed!
On February 23, 2019
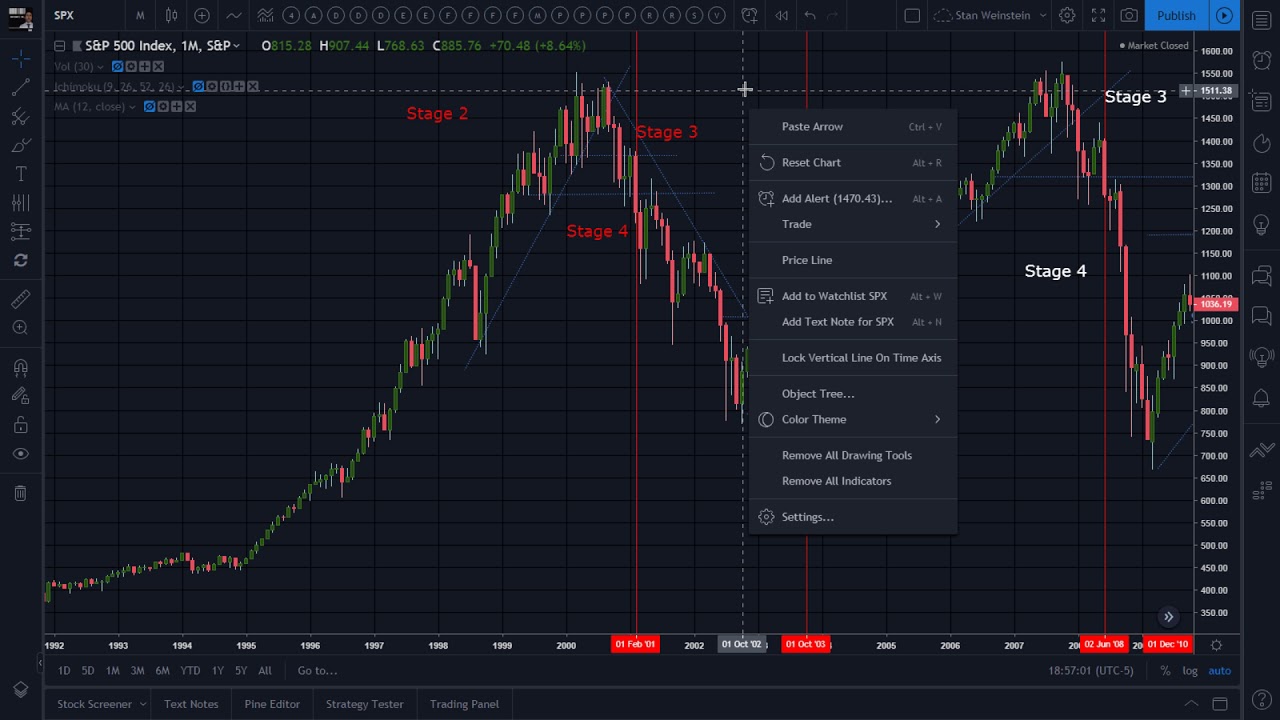
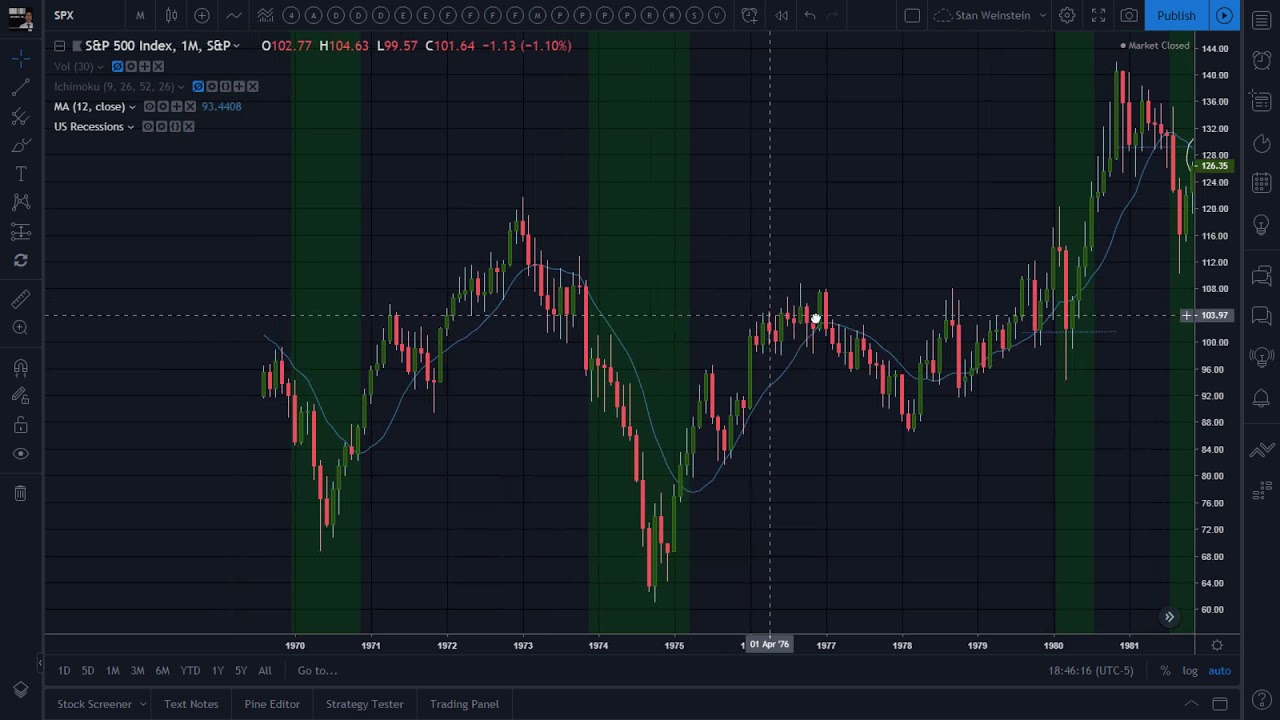
Secretwars #0359 – Markets Review: Using S&P 500 to demonstrate “trendline” StageAnalysis.
On February 22, 2019
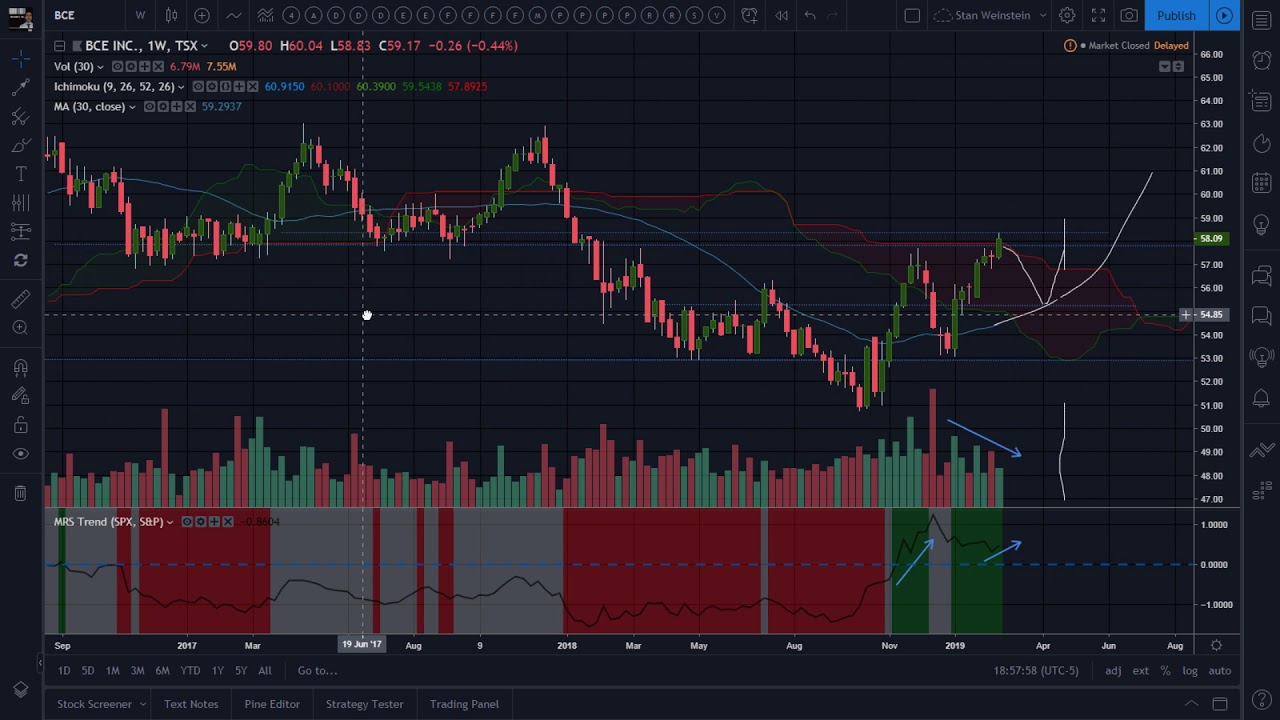
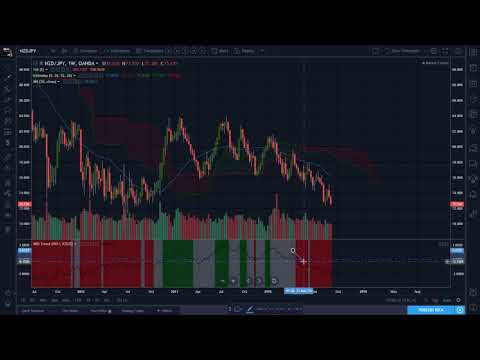
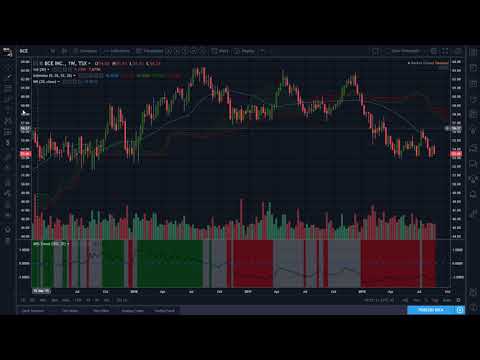
Secretwars #0358 – Why I will not play long BCE Inc.!
On February 21, 2019
Secretwars #0357 – Markets Review: US Oil pulling back up in it’s Stage 4 decline!
On February 20, 2019
Secretwars #0356 – Markets Review: What is the Gold/Silver Ratio telling us?
On February 19, 2019
Secretwars #0355 – Markets Review: Silver US Dollar in early Stage 2 territory!
On February 18, 2019
Secretwars #0354 – Markets Review: Shanghai Stock Exchange 50.
On February 17, 2019
Secretwars #0353 – Markets Review: Anatomy of market tops.
On February 17, 2019
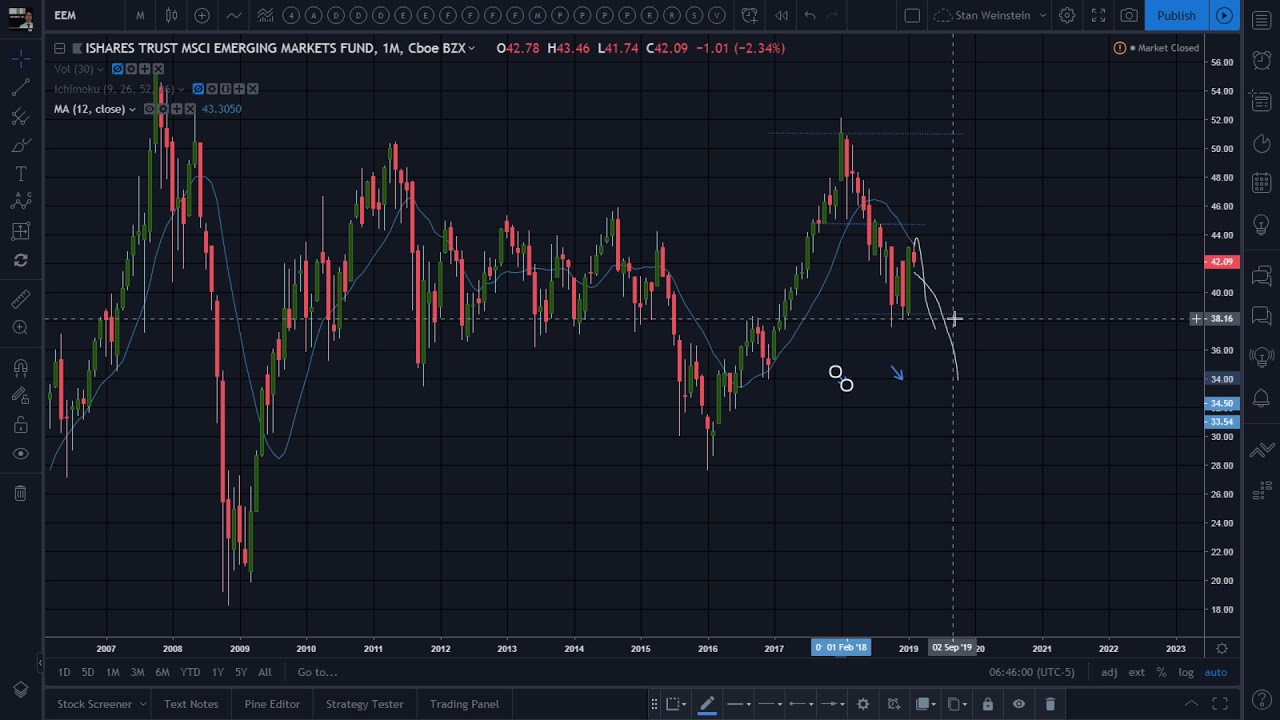
Secretwars #0352 – Markets Review: Ishares MSCI Emerging Markets Fund.
On February 15, 2019
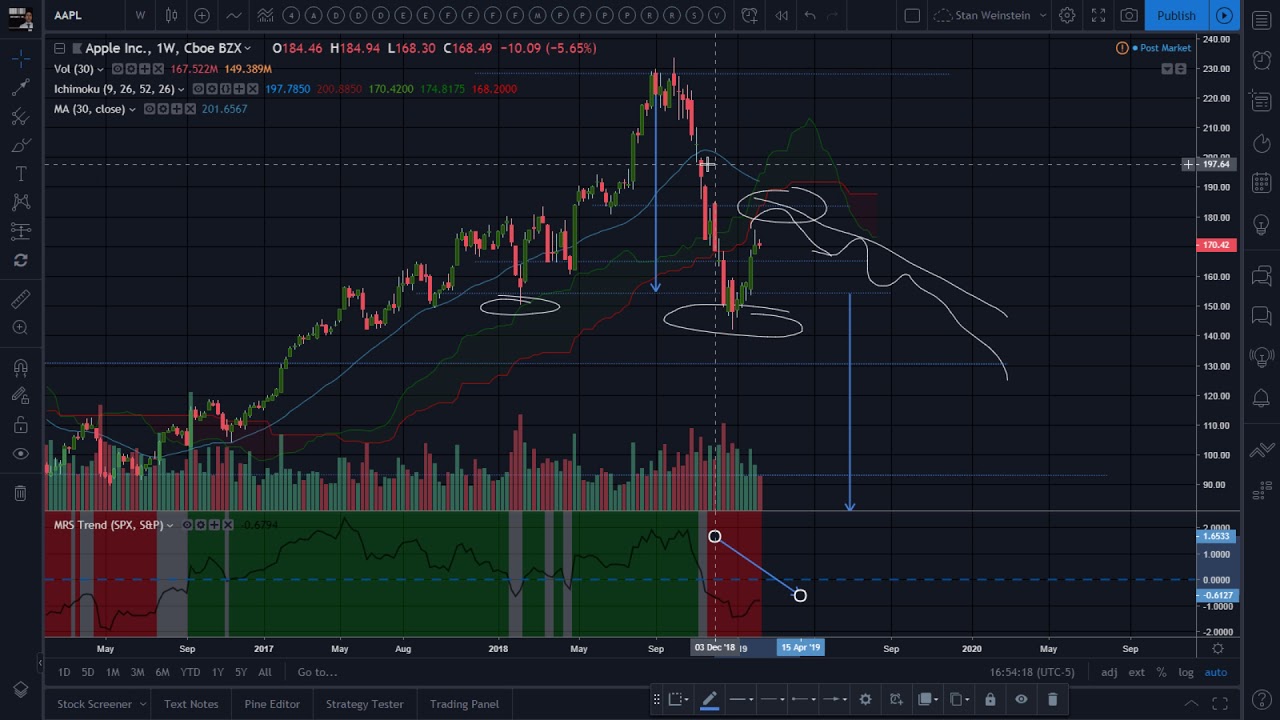
Secretwars #0351 – Apple getting ready to resume Stage 4 decline!
On February 14, 2019
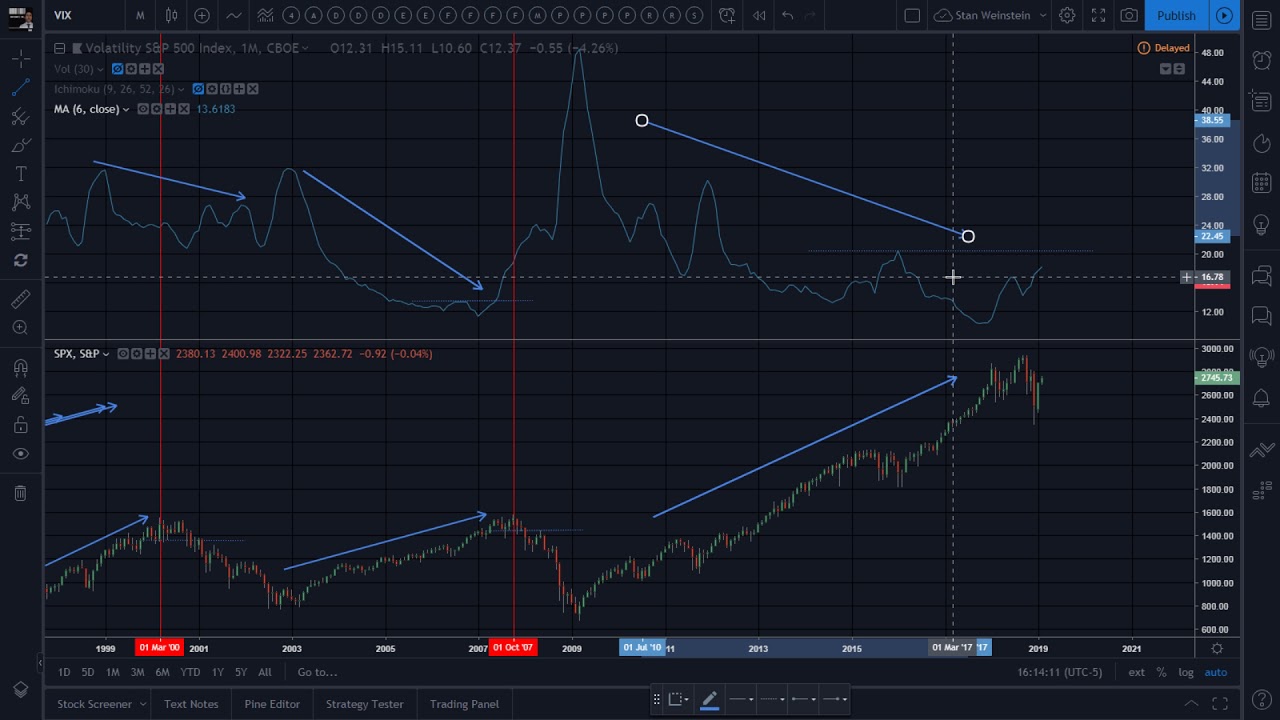
Secretwars #0350 – Markets Review: What is the Volatility Index telling me now?
On February 13, 2019
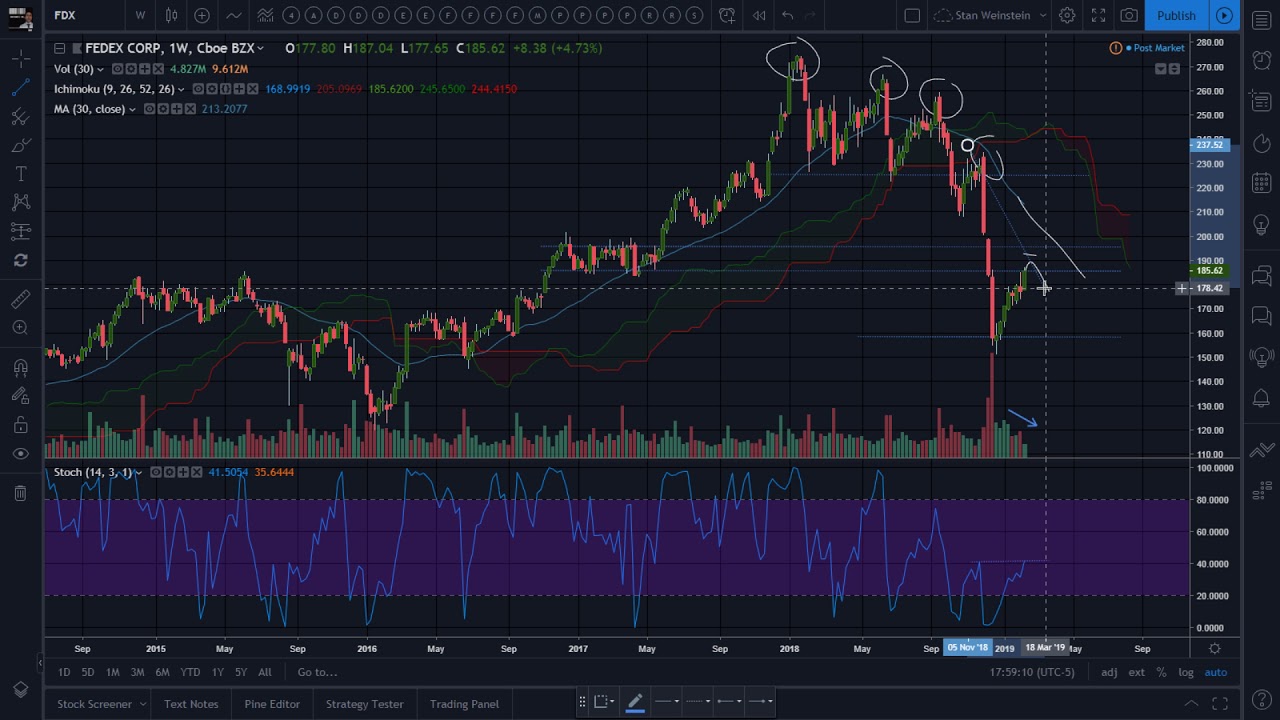
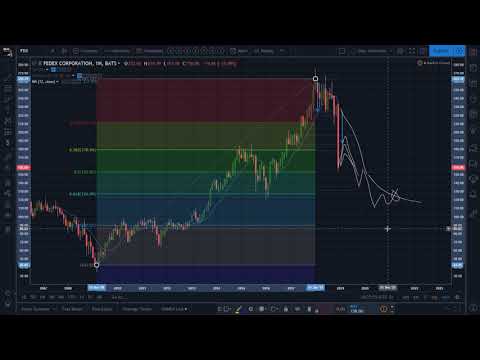
Secretwars #0349 – Revisiting Fedex Corporation, deep in a Stage 4 meltdown!
On February 12, 2019
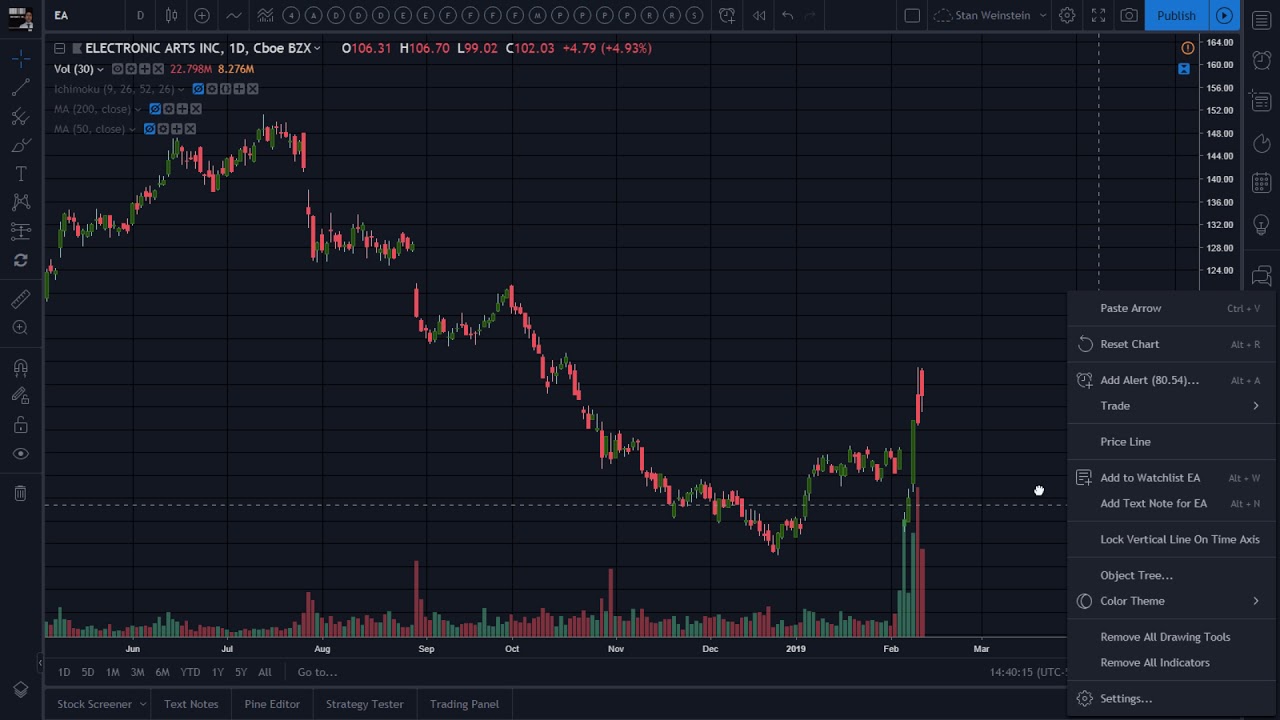
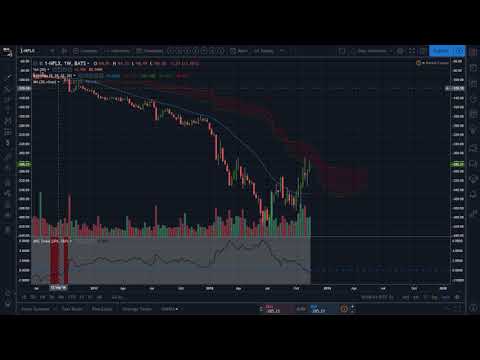
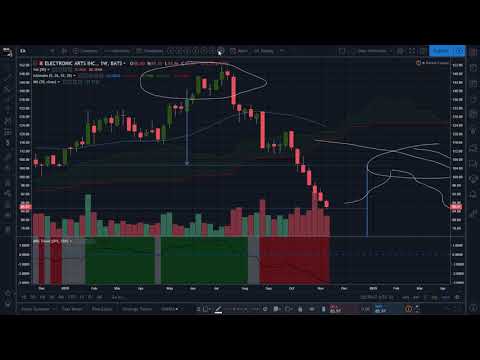
Secretwars #0348 – Electronic Arts to resume it’s Stage 4 downtrend?
On February 11, 2019
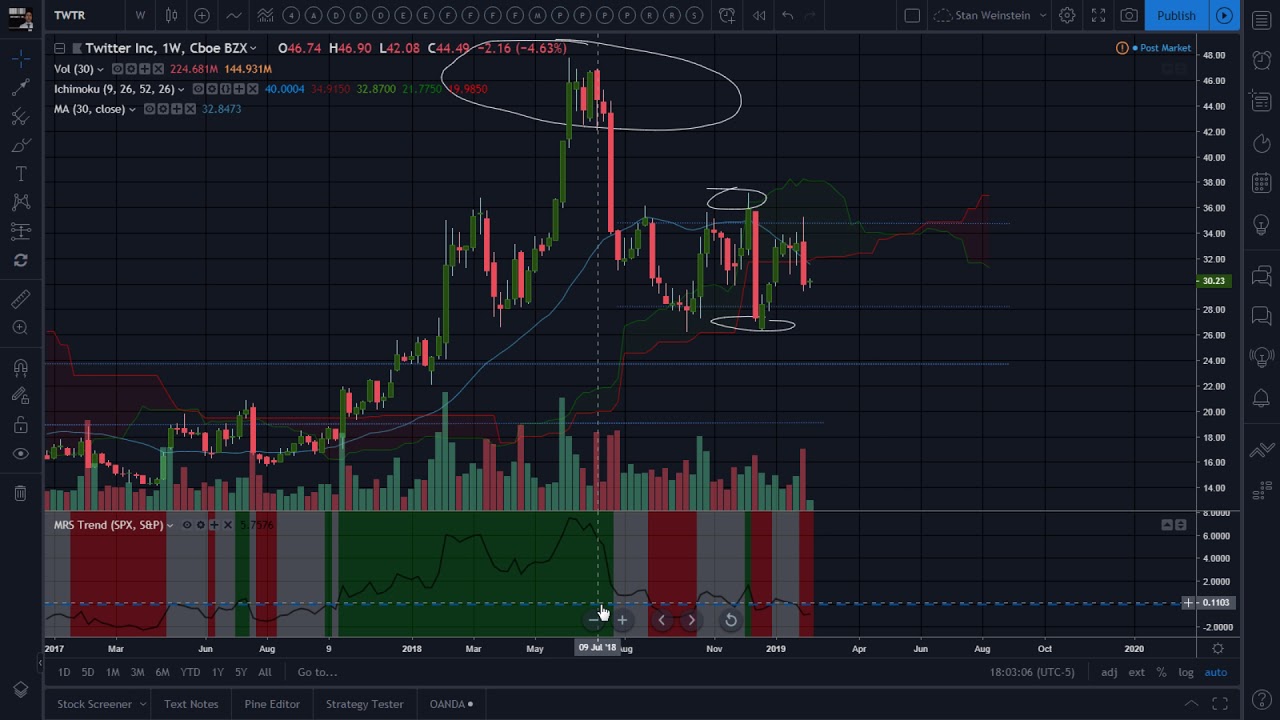
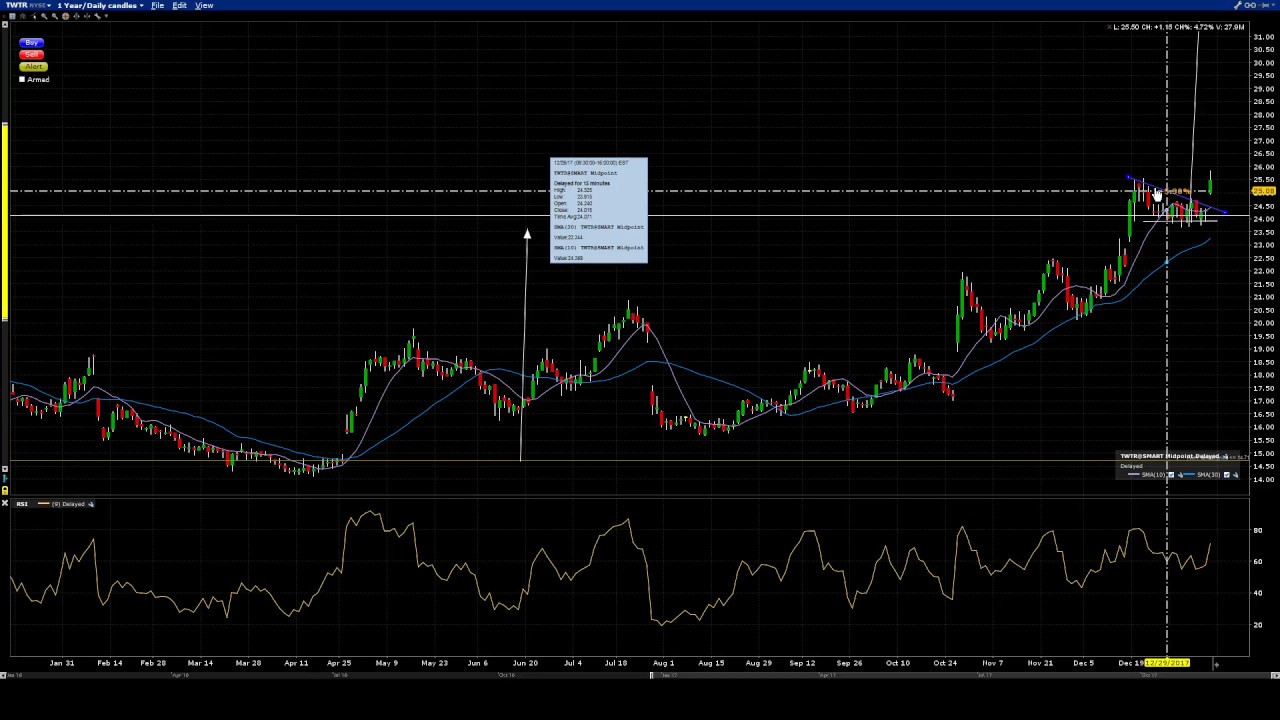
Secretwars #0347 – Revisiting Twitter, back in Stage 4 decline!
On February 10, 2019
Secretwars #0346 – Markets Review: Is that S&P 500 rally done yet?
On February 9, 2019
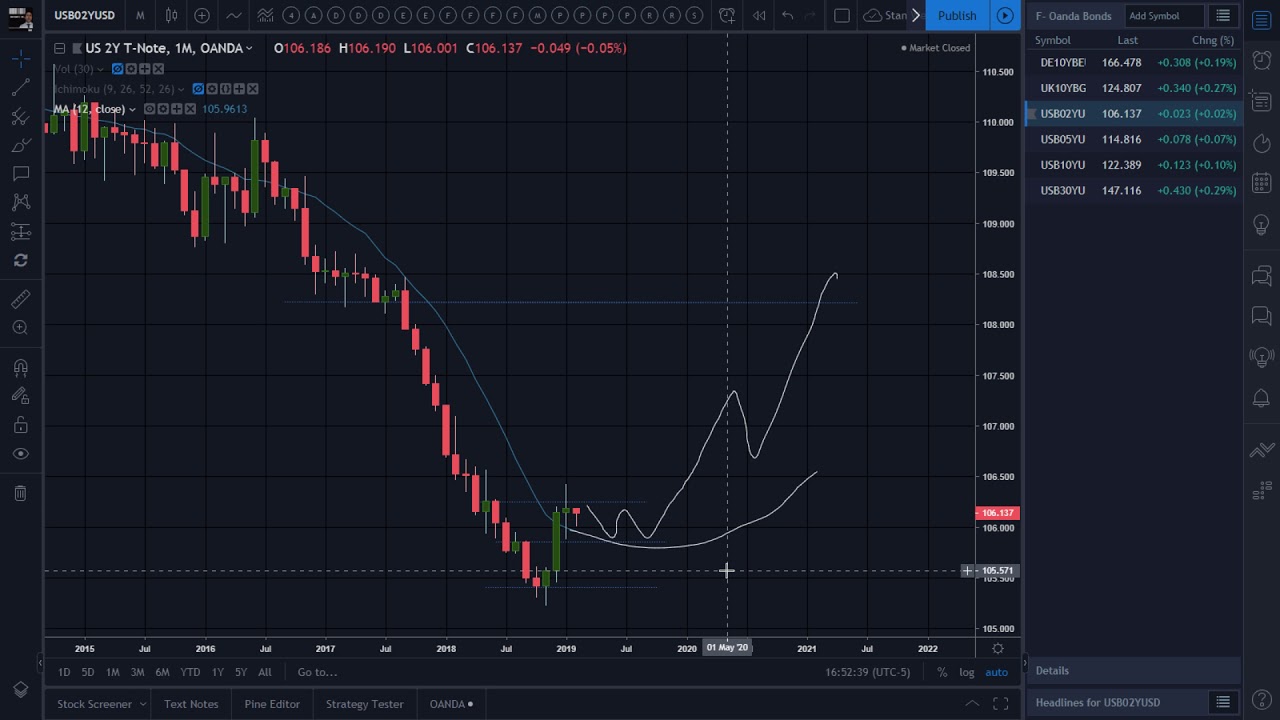
Secretwars #0345 – Markets Review: Treasuries & Bonds entering Stage 2!
On February 8, 2019
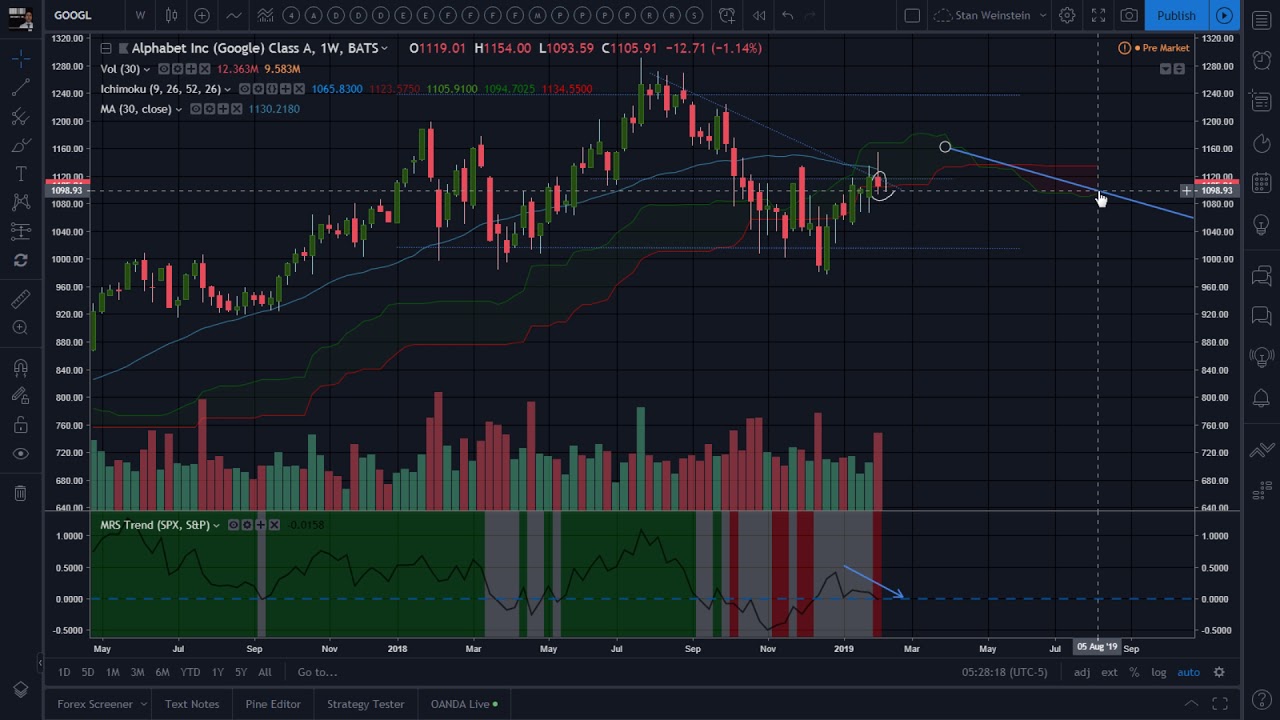
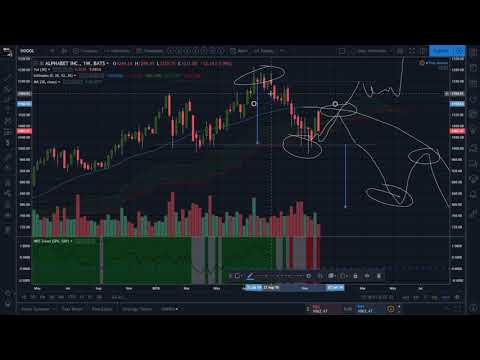
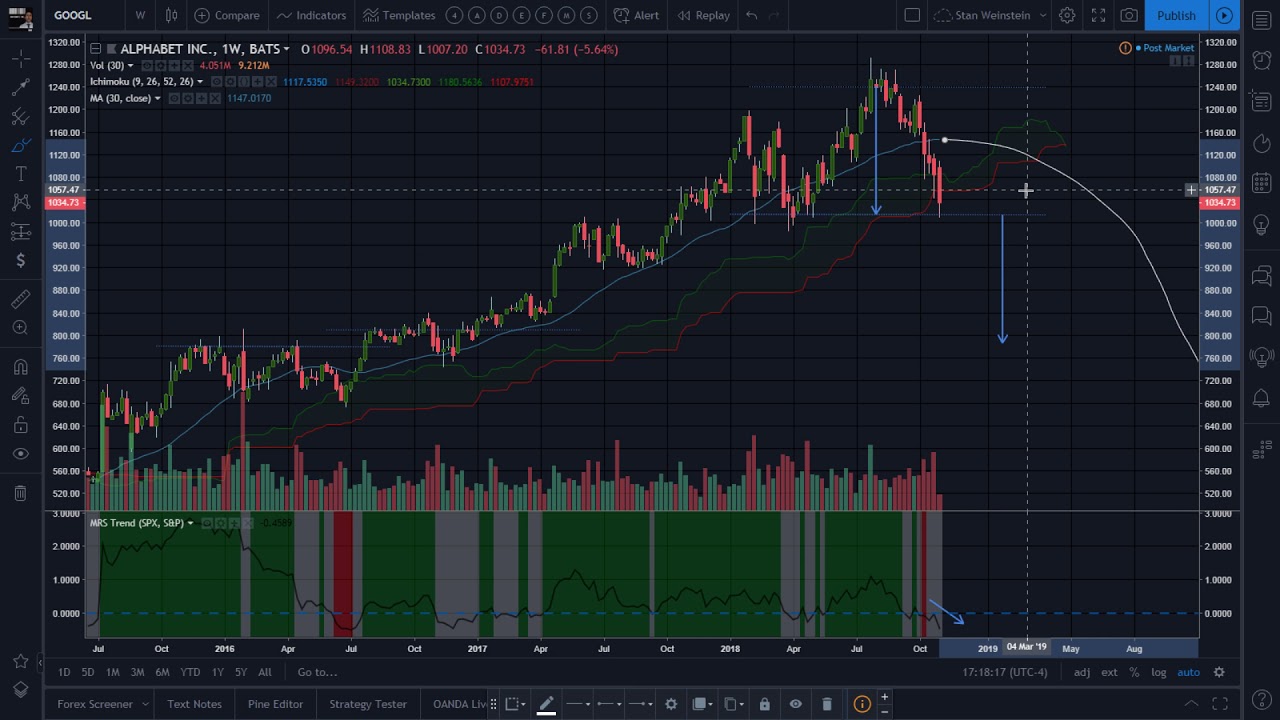
Secretwars #0344 – Revisiting Google Inc. on brink of Stage 4 entry!
On February 7, 2019
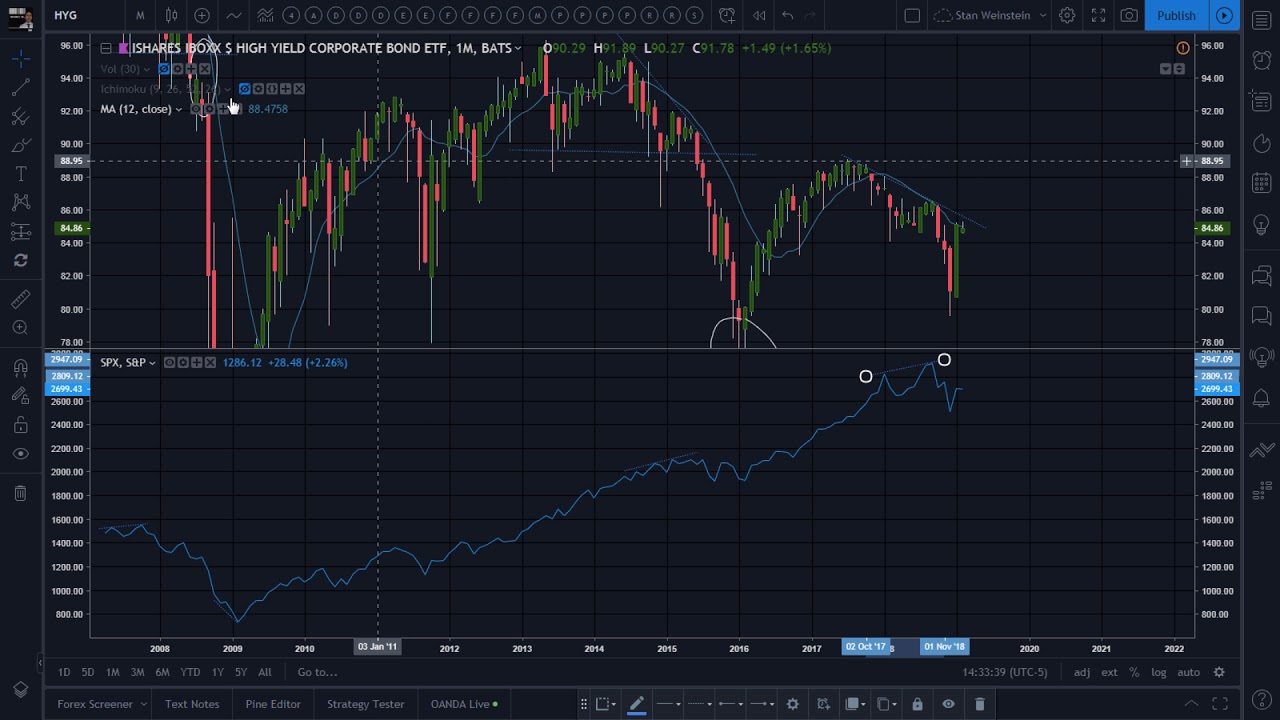
Secretwars #0343 – Markets Review: Ishares High Yield Corporate Bond ETF.
On February 7, 2019
Secretwars #0342 – Markets Review: Can S&P 500 “v-shape” recover from here?
On February 5, 2019
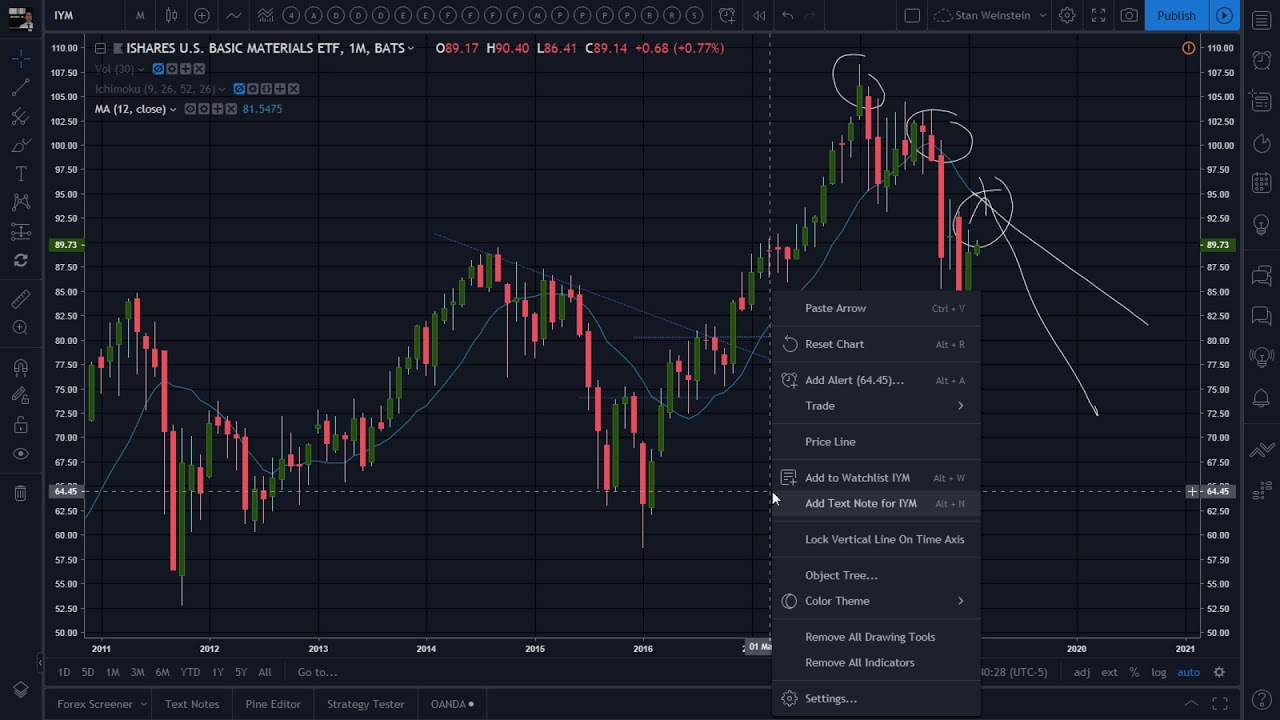
Secretwars #0341 – Markets Review: Ishares U.S. Basic Materials ETF.
On February 5, 2019
Secretwars #0340 – Markets Review: Copper slowing down it’s down slide…
On February 3, 2019
Secretwars #0339 – Markets Review: At crossroads for the Nasdaq…
On February 2, 2019
Secretwars #0338 – Deutsche Bank sinking into the abyss!
On February 1, 2019
Secretwars #0337 – Markets Review: Blitzing US & World markets.
On January 31, 2019
Secretwars #0336 – Abbvie Inc. slipping down a Stage 4 slope!
On January 31, 2019
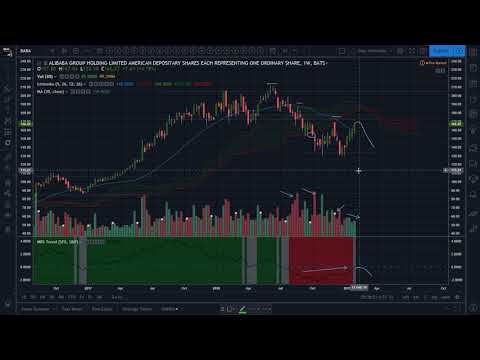
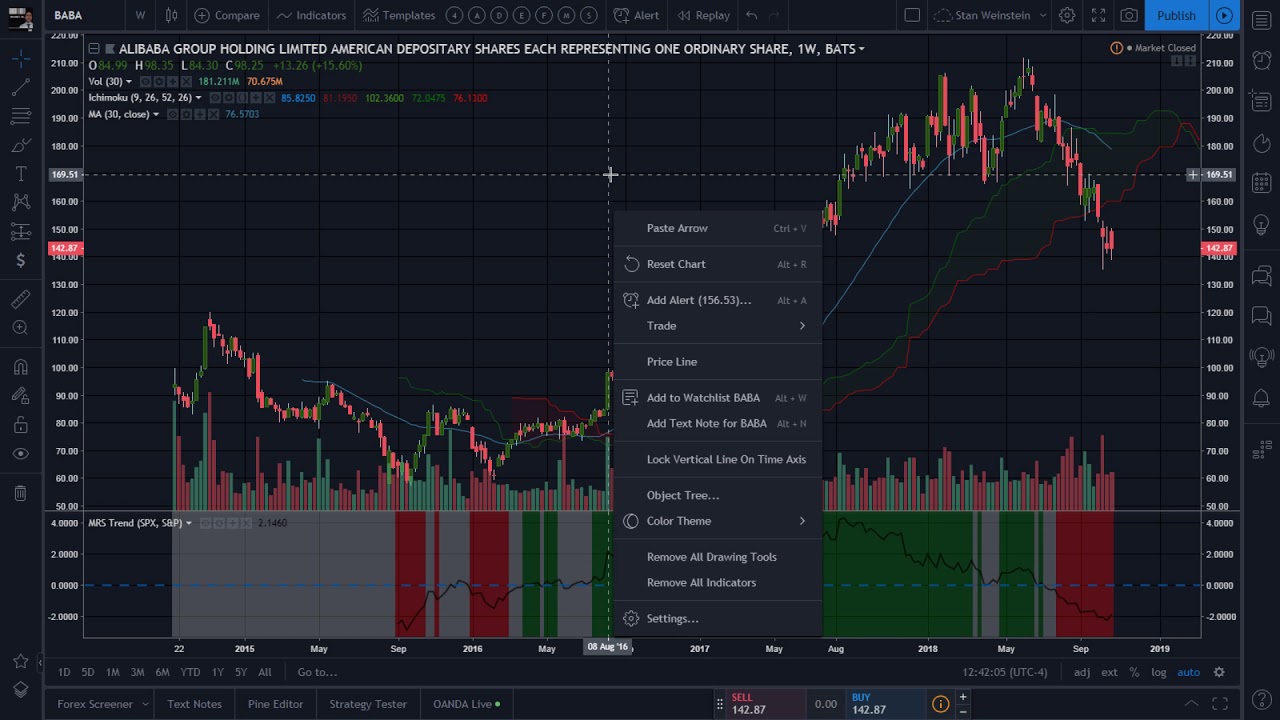
Secretwars #0335 – Alibaba on brink of exiting Stage 4 decline!
On January 29, 2019
Secretwars #0334 – Markets Review: Gold US Dollar getting ready to breakout!
On January 28, 2019
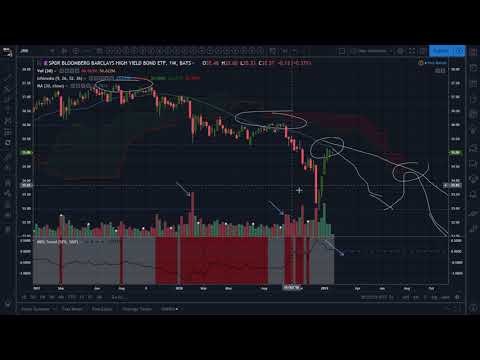
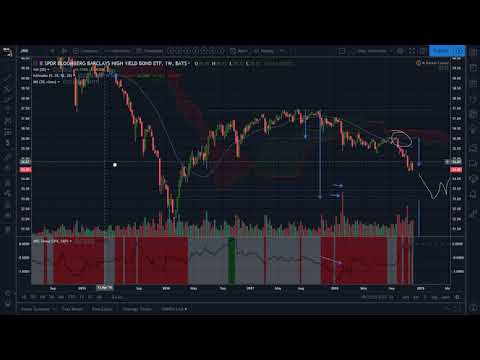
Secretwars #0333 – Markets Review: Barclays High Yield Bond ETF still in Stage 4!
On January 27, 2019
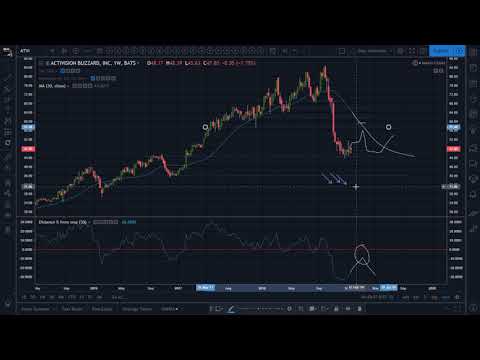
Secretwars #0332 – Activision Blizzard Inc. deep in a Stage 4 decline!
On January 26, 2019
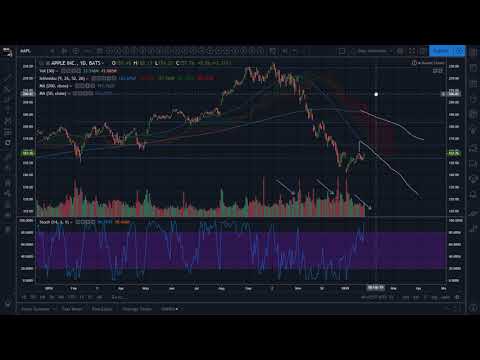
Secretwars #0331 – Revisiting Apple and it’s Nasdaq household!
On January 25, 2019
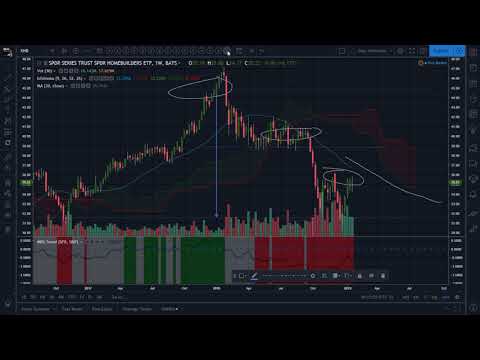
Secretwars #0330 – Markets Review: HomeBuilders still in a Stage 4!
On January 24, 2019
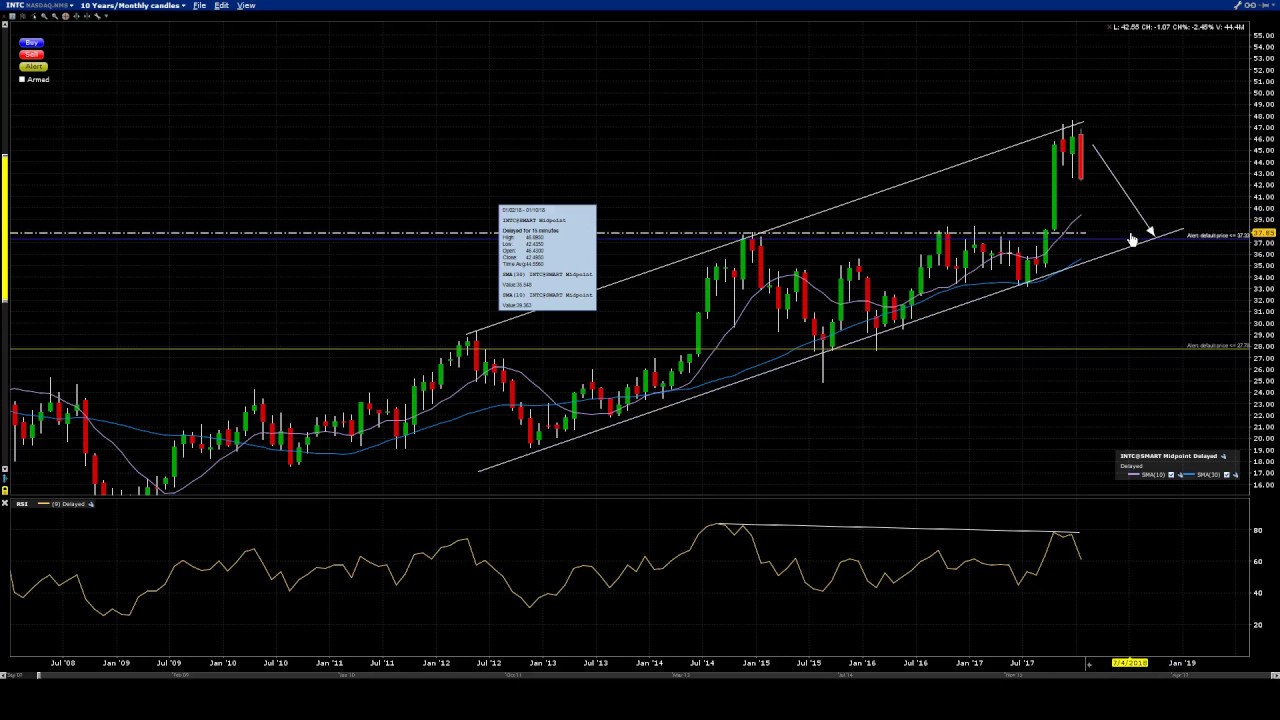
Secretwars #0329 – Revisiting Intel Corp., stretching it’s Stage 3!
On January 23, 2019
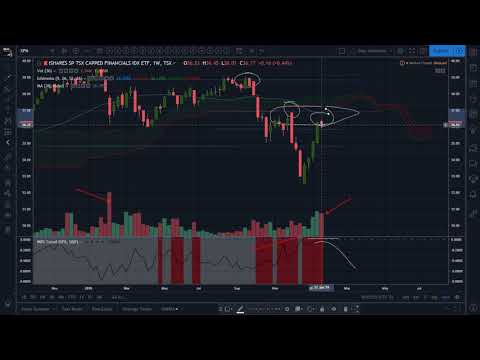
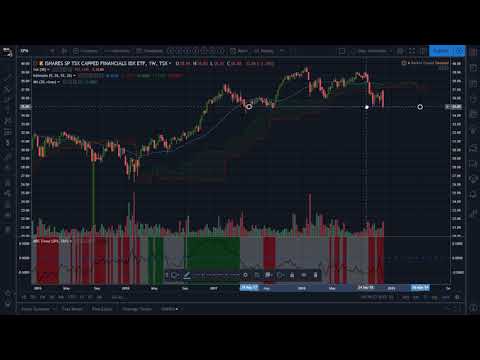
Secretwars #0328 – Revisiting iShares S&P TSX Capped Financials Index Fund!
On January 22, 2019
Secretwars #0327 – Markets Review: End of the World, still in progress!
On January 21, 2019
Secretwars #0326 – Revisiting Morgan Stanley, still in a Stage 4 decline!
On January 20, 2019
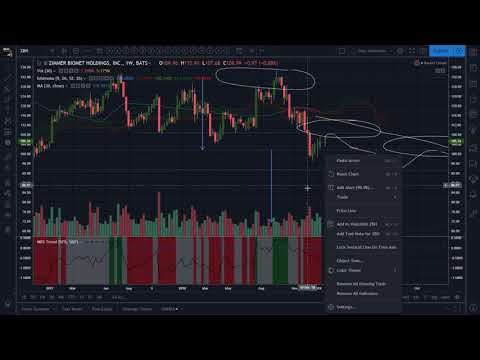
Secretwars #0325 – Zimmer Biomet Holdings pulling back in it’s Stage 4 decline.
On January 19, 2019
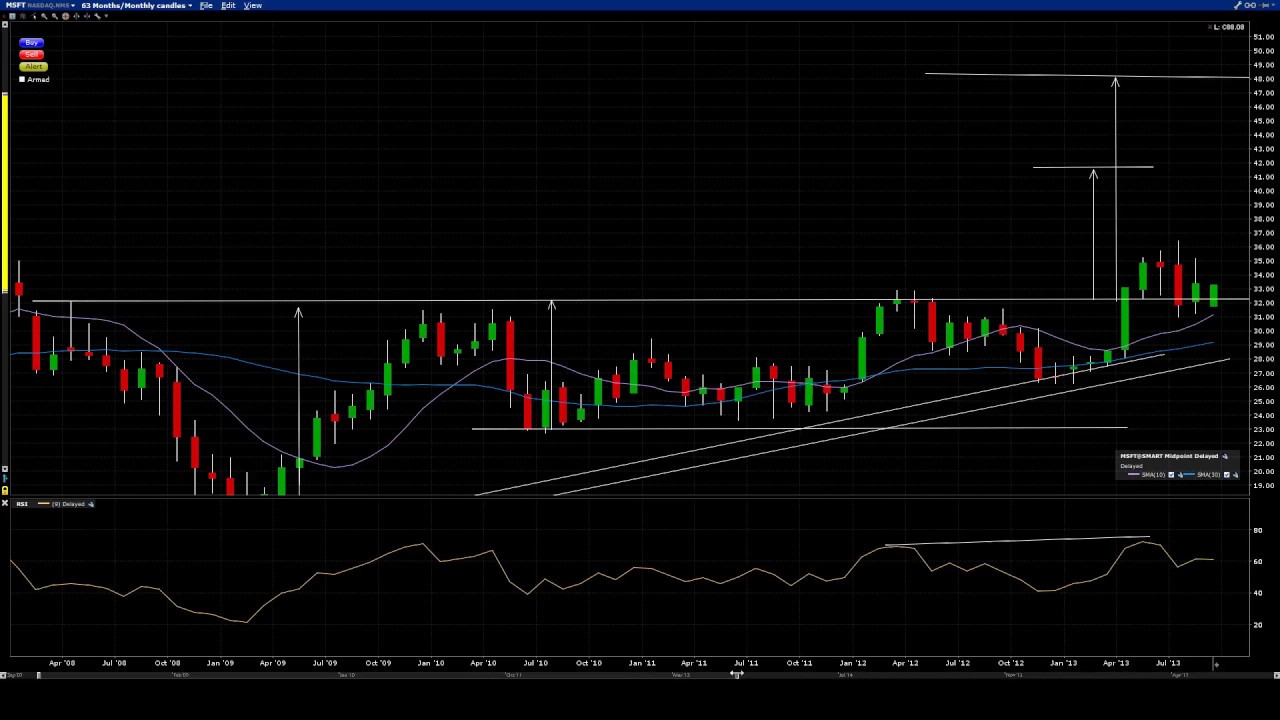
Secretwars #0324 – Revisiting Microsoft Corporation, now in a Stage 3.
On January 18, 2019
Secretwars #0323 – Markets Review: Looking under the hood with S&P Sectors!
On January 17, 2019
Secretwars #0322 – Markets Review: Nikkei 225 underperforming S&P 500!
On January 16, 2019
Secretwars #0321 – Revisiting Facebook, still in a Stage 4 disaster!
On January 15, 2019
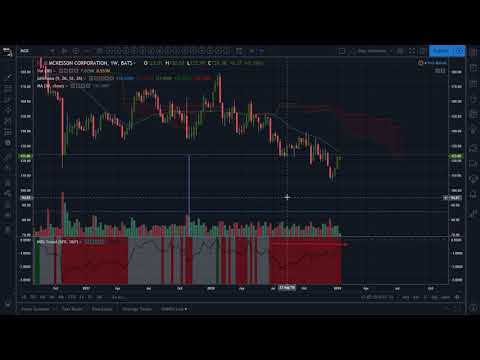
Secretwars #0320 – Revisiting McKesson Corp., declining since 2015!
On January 14, 2019
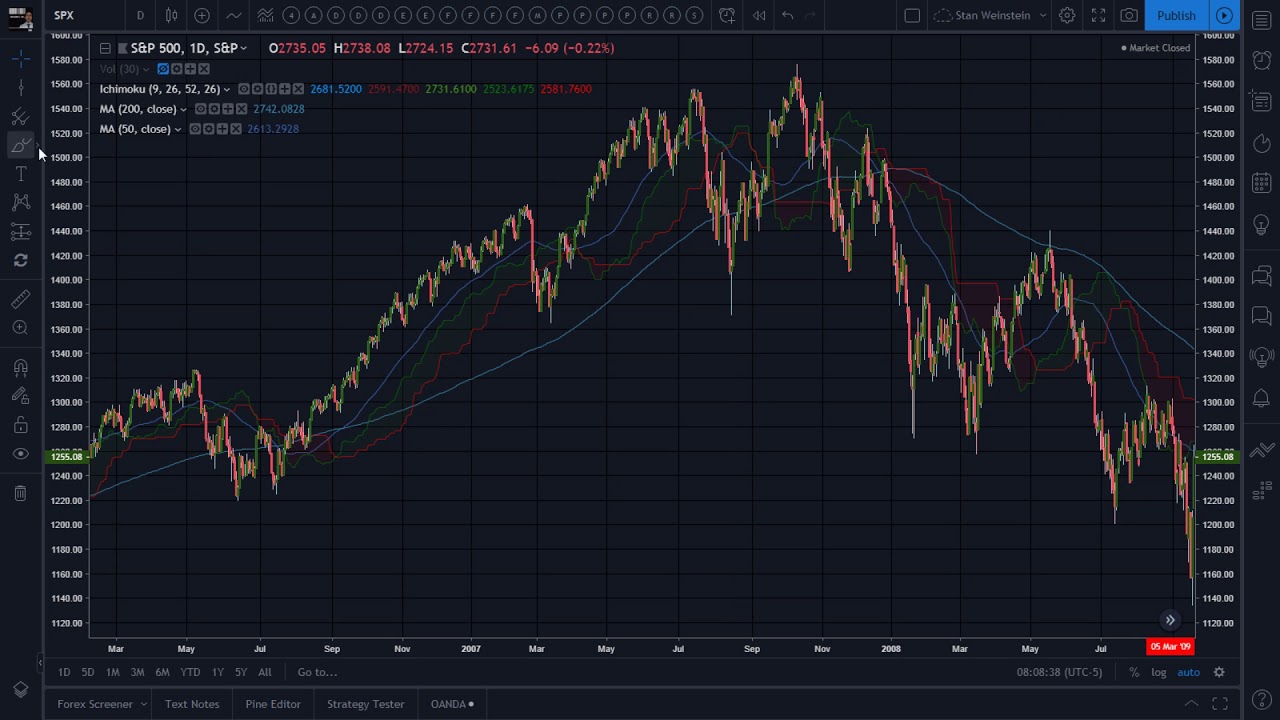
Secretwars #0319 – Markets Review: The 2015 S&P short that cried wolf!
On January 13, 2019
Secretwars #0318 – Sugar building it’s case for a Stage 2 breakout!
On January 12, 2019
Secretwars #0317 – Markets Review: Semiconductors ready to resume decline!
On January 12, 2019
Secretwars #0316 – Markets Review: Strong pullback for the TSX Composite Index!
On January 10, 2019
Secretwars #0315 – Markets Review: How to use Economic Data as indicators.
On January 9, 2019
Secretwars #0314 – Markets Review: Japan 1990 vs Nasdaq 2019!
On January 8, 2019
Secretwars #0313 – Markets Review: Inspecting the Russel 2000.
On January 8, 2019
Secretwars #0312 – Markets Review: Worried about that Nasdaq pullback?
On January 6, 2019
Secretwars #0311 – Google working hard to avoid Stage 4 meltdown!
On January 5, 2019
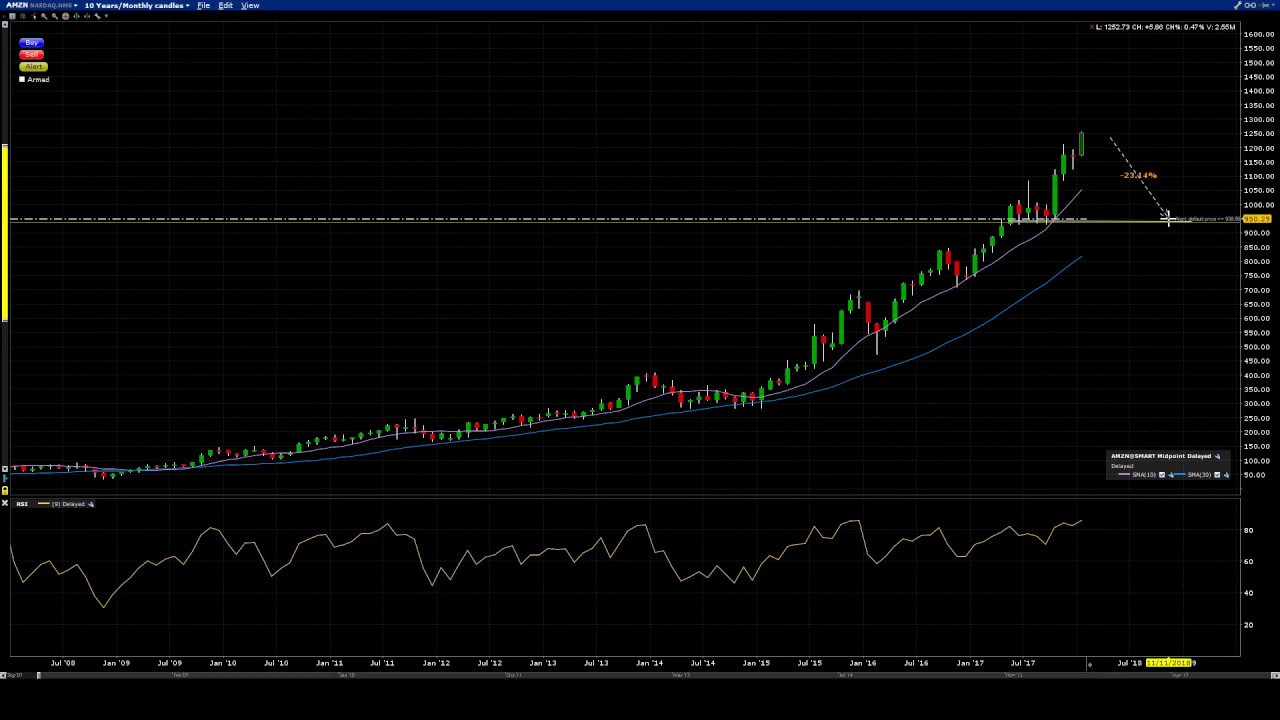
Secretwars #0310 – Will Amazon stay in Stage 3 much longer?
On January 4, 2019
Secretwars #0309 – Markets Review: Is this still a simple pullback for S&P 500?
On January 3, 2019
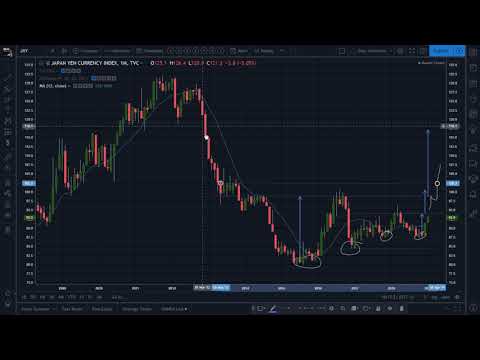
Secretwars #0308 – Forex Review: Japan Yen Currency Index.
On January 2, 2019
Secretwars #0307 – Markets Review: CBOE Volatility Index spiking higher!
On January 1, 2019
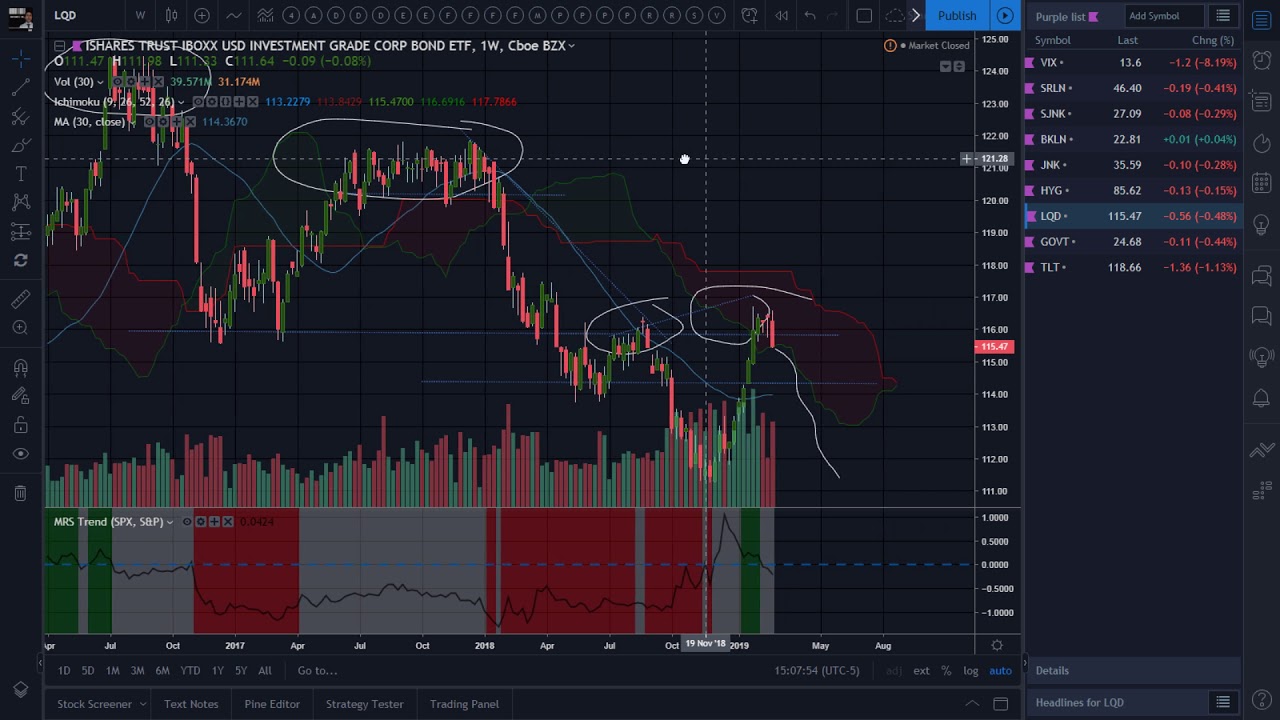
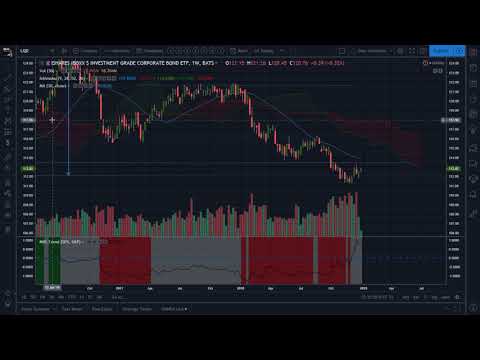
Secretwars #0306 – Ishares Iboxx $ Investment Grade Corporate Bond ETF.
On January 1, 2019
Secretwars #0305 – Forex Review: Loonie declining vs multiple currencies!
On December 30, 2018
Secretwars #0304 – The Walt Disney Compnay in a Stage 3.
On December 29, 2018
Secretwars #0303 – Revisiting Facebook’s advancing Stage 4.
On December 29, 2018
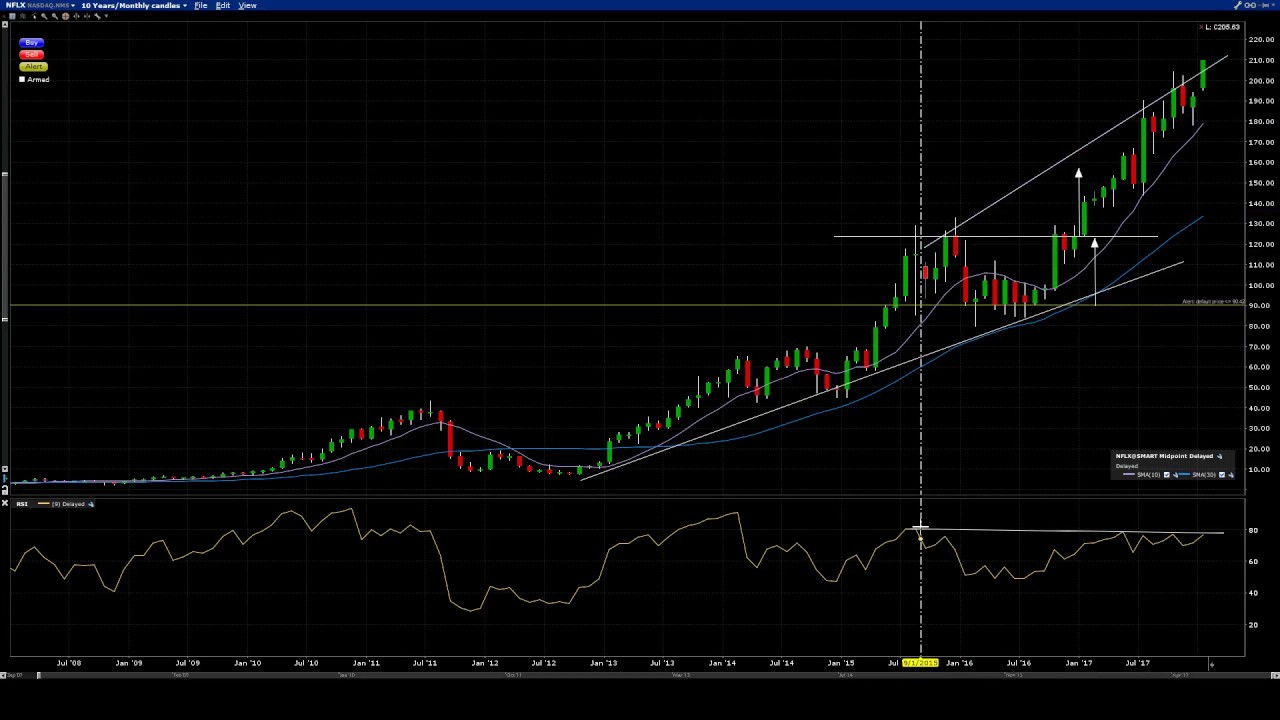
Secretwars #0302 – Revisiting Netflix, now in a Stage 4 decline.
On December 27, 2018
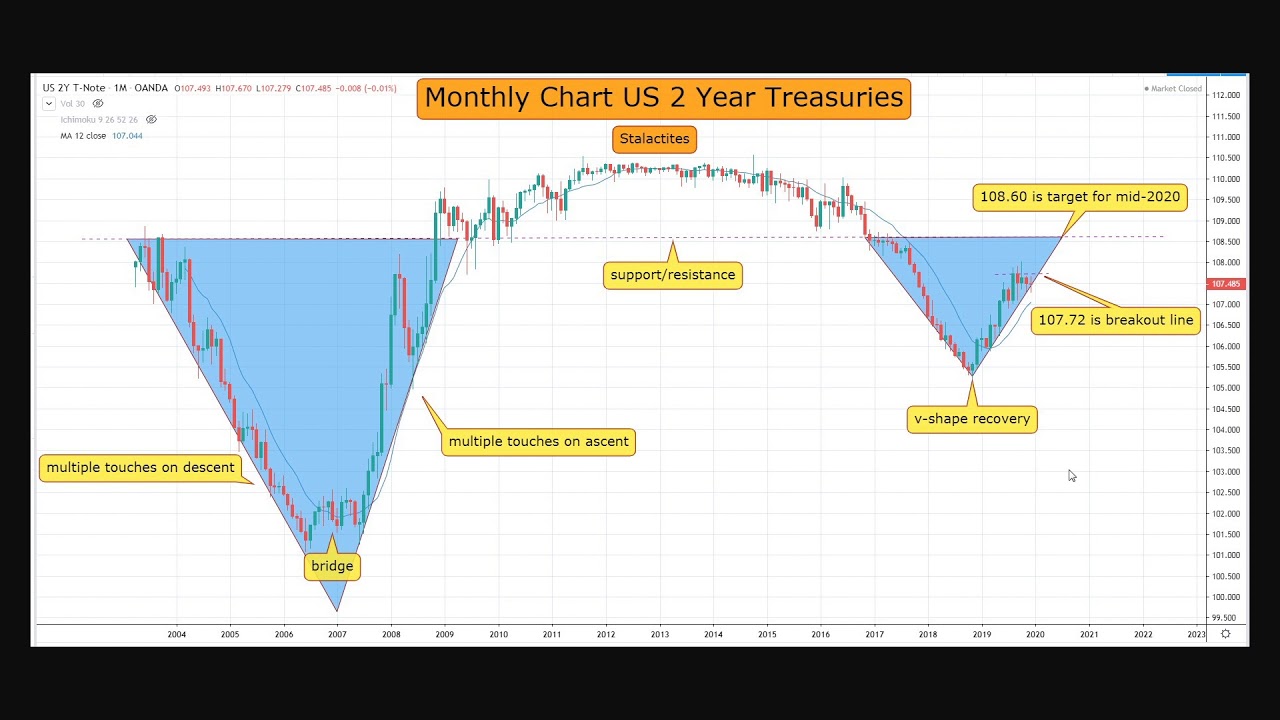
Secretwars #0301 – Markets Review: U.S. Treasury Notes and Bonds!
On December 26, 2018
Secretwars #0300 – Markets Review: Revisiting S&P sectors.
On December 25, 2018
Secretwars #0299 – AT&T Inc. continuing it’s Stage 4 decline.
On December 25, 2018
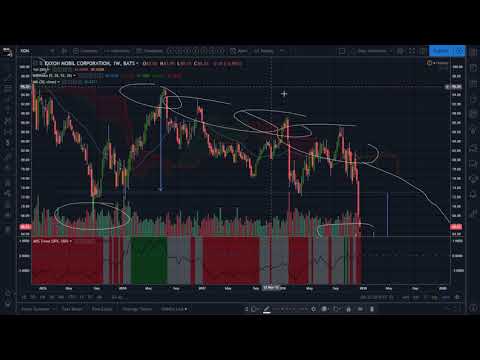
Secretwars #0298 – Revisiting Exxon Mobil, now slithering into a Stage 4.
On December 23, 2018
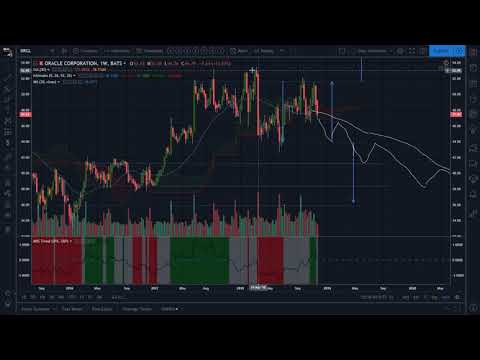
Secretwars #0297 – Revisiting Oracle, entering Stage 4 territory!
On December 22, 2018
Secretwars #0296 – Fedex Corp plunged into a Stage 4 abyss!
On December 21, 2018
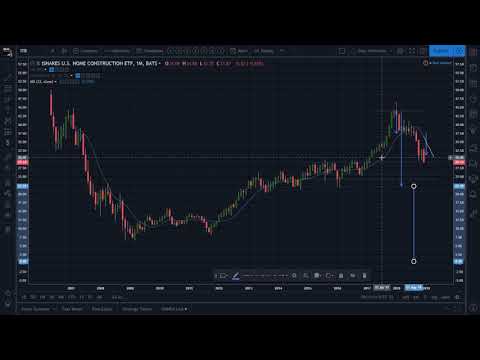
Secretwars #0295 – Markets Review: Ishares U.S. Home Construction.
On December 20, 2018
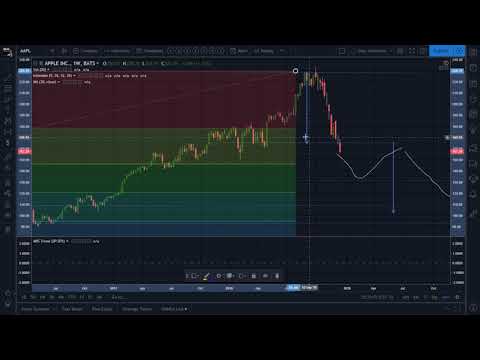
Secretwars #0294 – Revisiting Apple, now in a Stage 4 cleanse!
On December 19, 2018
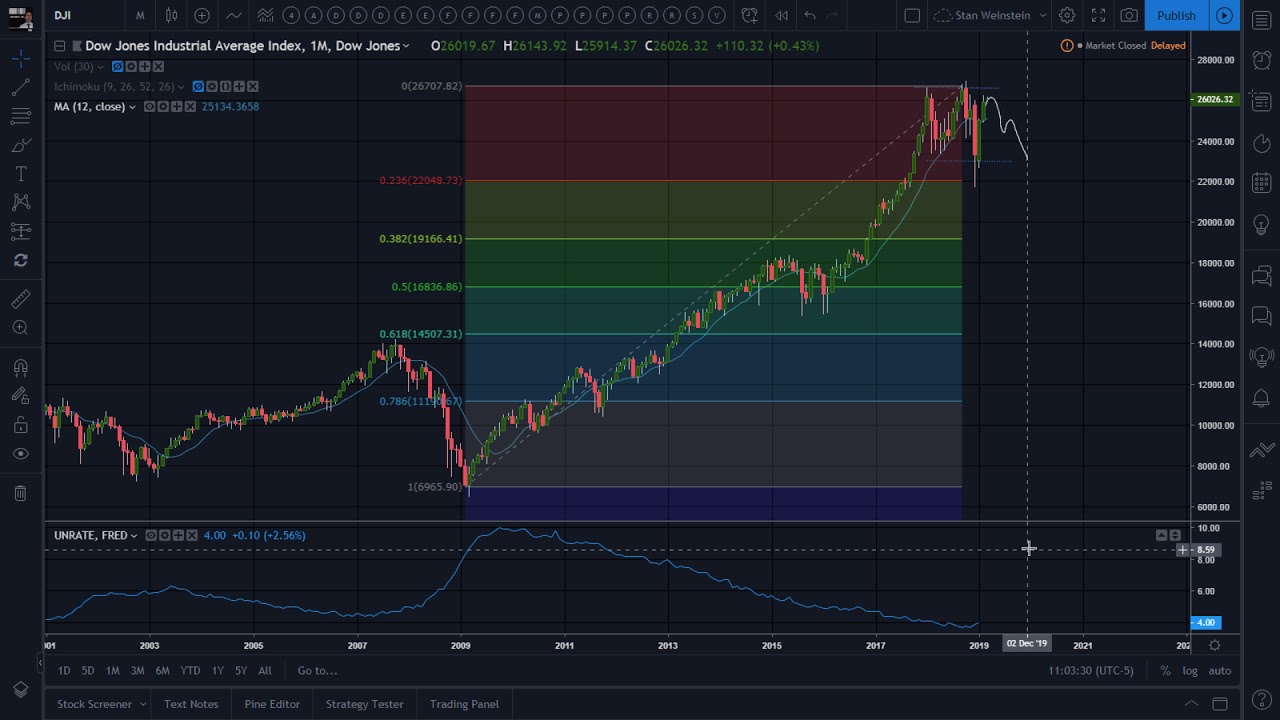
Secretwars #0293 – Markets Review: Dow Jones last American to go down!
On December 18, 2018
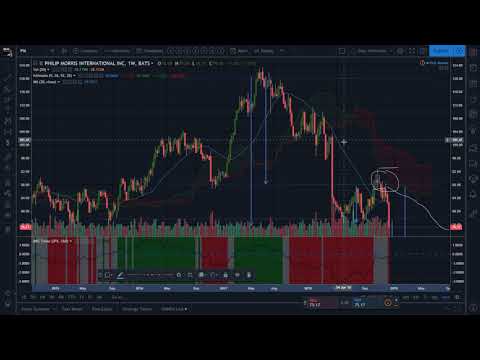
Secretwars #0292 – Stage 4 continuation for Philip Morris International!
On December 17, 2018
Secretwars #0291 – Markets Review: This is the end of the World!
On December 16, 2018
Secretwars #0290 – Caterpillar Inc. back in a Stage 4 decline!
On December 15, 2018
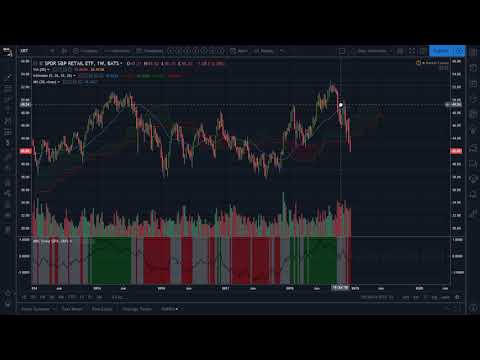
Secretwars #0289 – Markets Review: Stage 4 for SPDR S&P Retail ETF.
On December 14, 2018
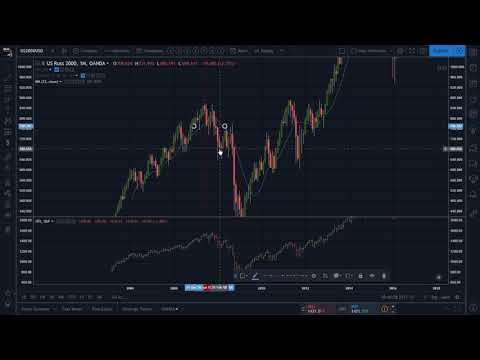
Secretwars #0288 – Markets Review: US Russel 2000 in a Stage 4 meltdown!
On December 13, 2018
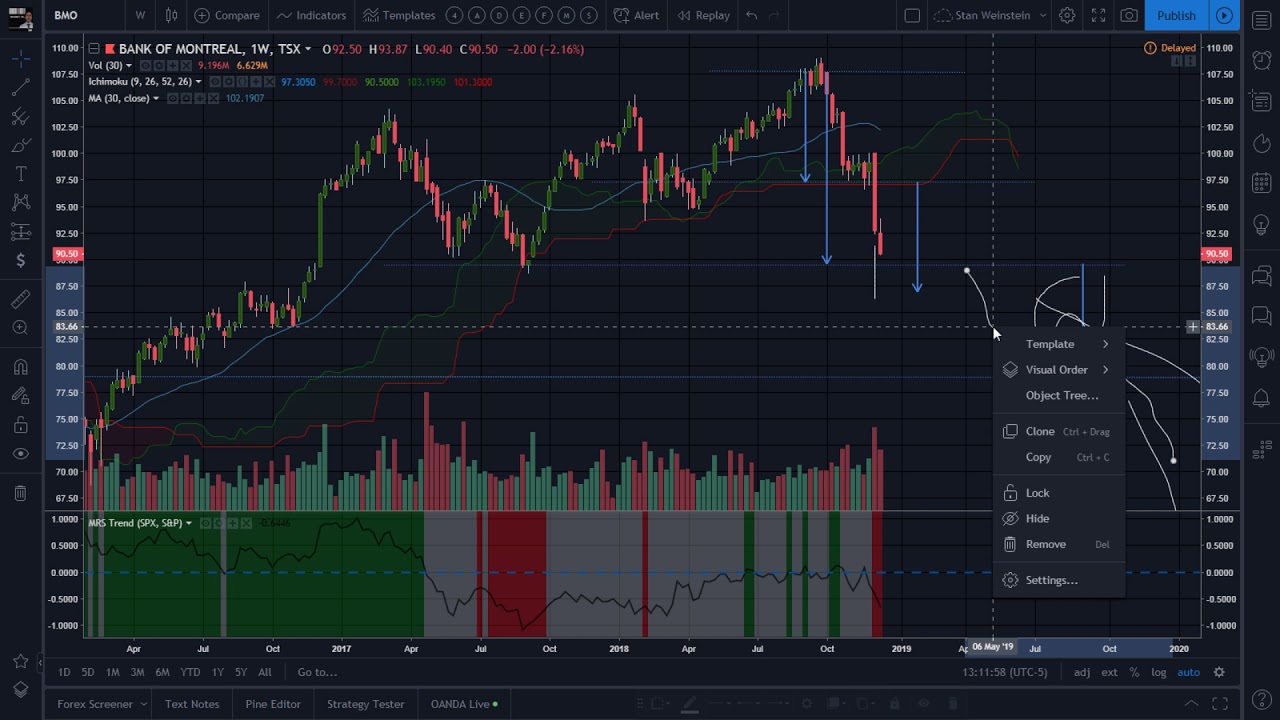
Secretwars #0287 – Revisiting Bank of Montreal, now in a Stage 4 disaster!
On December 13, 2018
Secretwars #0286 – Kirkland Lake Gold looking to continue it’s Stage 2!
On December 11, 2018
Secretwars #0285 – Revisiting Barrick Gold closing in on Stage 2 breakout!
On December 10, 2018
Secretwars #0284 – Is American Electric Power in a Stage 2?
On December 9, 2018
Secretwars #0283 – Markets Review: Junk bonds, are these for real?
On December 8, 2018
Secretwars #0282 – Revisting Bank of America, now in Stage 4 decline!
On December 7, 2018
Secretwars #0281 – Revisiting iShares S&P TSX Capped Financials Index Fund.
On December 6, 2018
Secretwars #0280 – Markets Review: Borderline meltdown for Nikkei 225.
On December 5, 2018
Secretwars #0279 – Markets Review: Ishares MSCI Canada Index Fund ETF.
On December 4, 2018
Secretwars #0278 – Revisiting Google, still on the brink of collapse!
On December 3, 2018
Secretwars #0277 – Stage 4 for SPDR S&P Global Natural Resources ETF.
On December 2, 2018
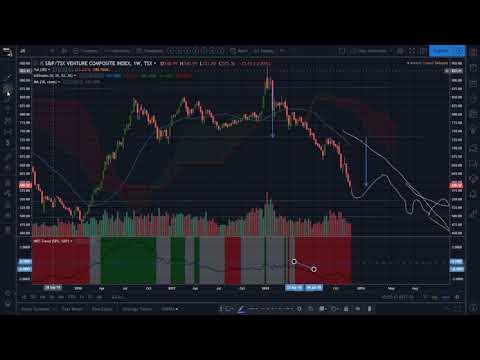
Secretwars #0276 – Markets Review: How low can TSX Venture go?
On December 1, 2018
Secretwars #0275 – Markets Review: Disaster for the Australia 200 index?
On November 30, 2018
Secretwars #0274 – Markets Review: Oh Canada!
On November 29, 2018
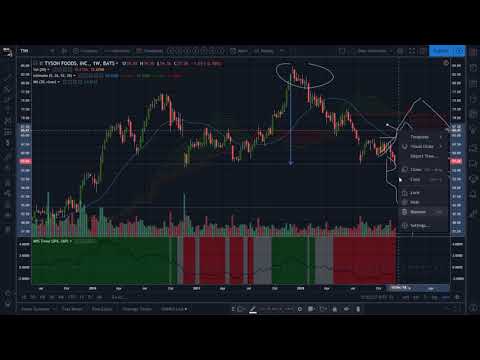
Secretwars #0273 – Tyson Foods in a slowing Stage 4.
On November 29, 2018
Secretwars #0272 – Markets Review: The World’s End – Part 2!
On November 27, 2018
Secretwars #0271 – Revisiting Oracle, now in Stage 3.
On November 26, 2018
Secretwars #0270 – Revisiting Amazon, approaching Stage 4 territory!
On November 25, 2018
Secretwars #0269 – Home depot below the cloud and breaking down!
On November 24, 2018
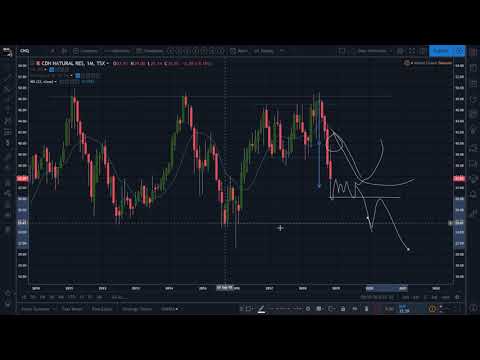
Secretwars #0268 – Revisting Canadian National Resources, now breaking down!
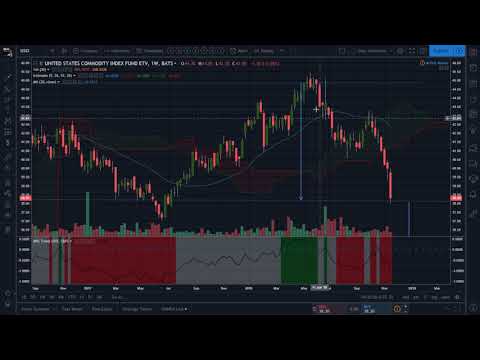
On November 23, 2018
Secretwars #0267 – Stage 4 for United States Commodity Index Fund.
On November 22, 2018
Secretwars #0266 – Markets Review: Will S&P 500 playout like 2008?
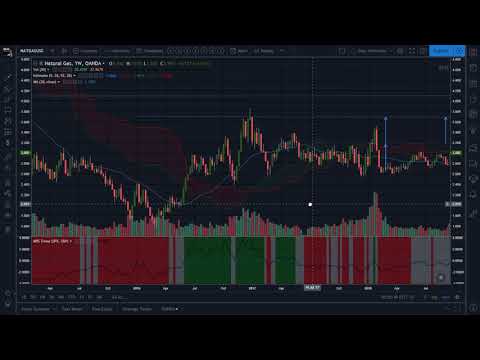
On November 21, 2018
Secretwars #0265 – Natural Gas, in an explosive Stage 2!
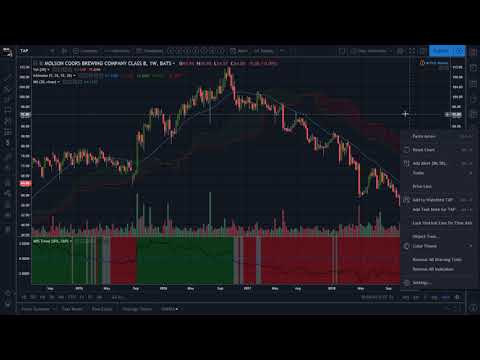
On November 20, 2018
Secretwars #0264 – Molson Coors Brewing Co, slowing Stage 4.
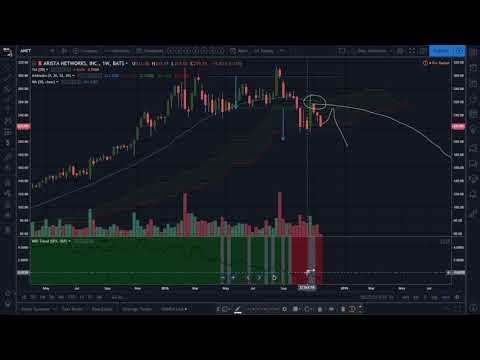
On November 20, 2018
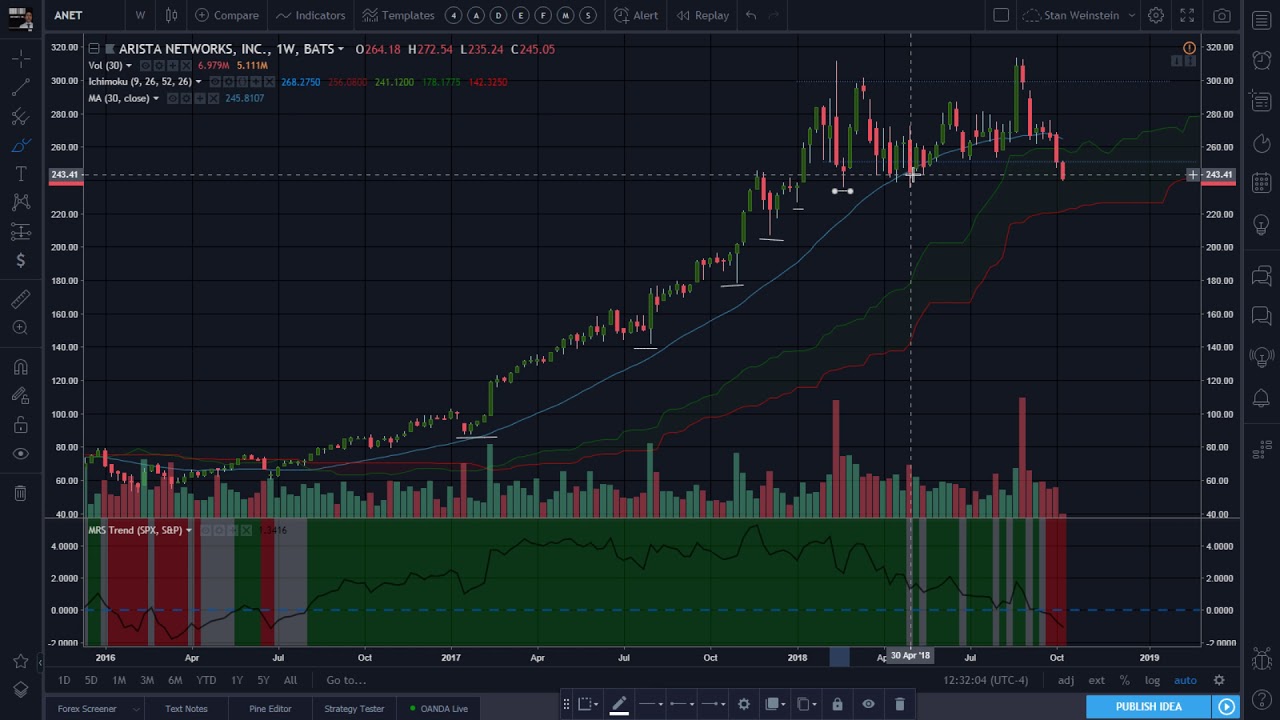
Secretwars #0263 – Revisiting Arista Networks, advancing Stage 4.
On November 18, 2018
Secretwars #0262 – Revisiting Netflix, entering Stage 4 territory.
On November 18, 2018
Secretwars #0261 – Revisiting Electronics Arts, now in Stage 4 meltdown!
On November 16, 2018
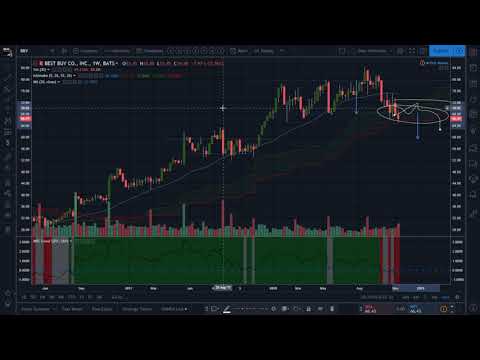
Secretwars #0260 – Early Stage 4 decline in progress for Best Buy Co.
On November 15, 2018
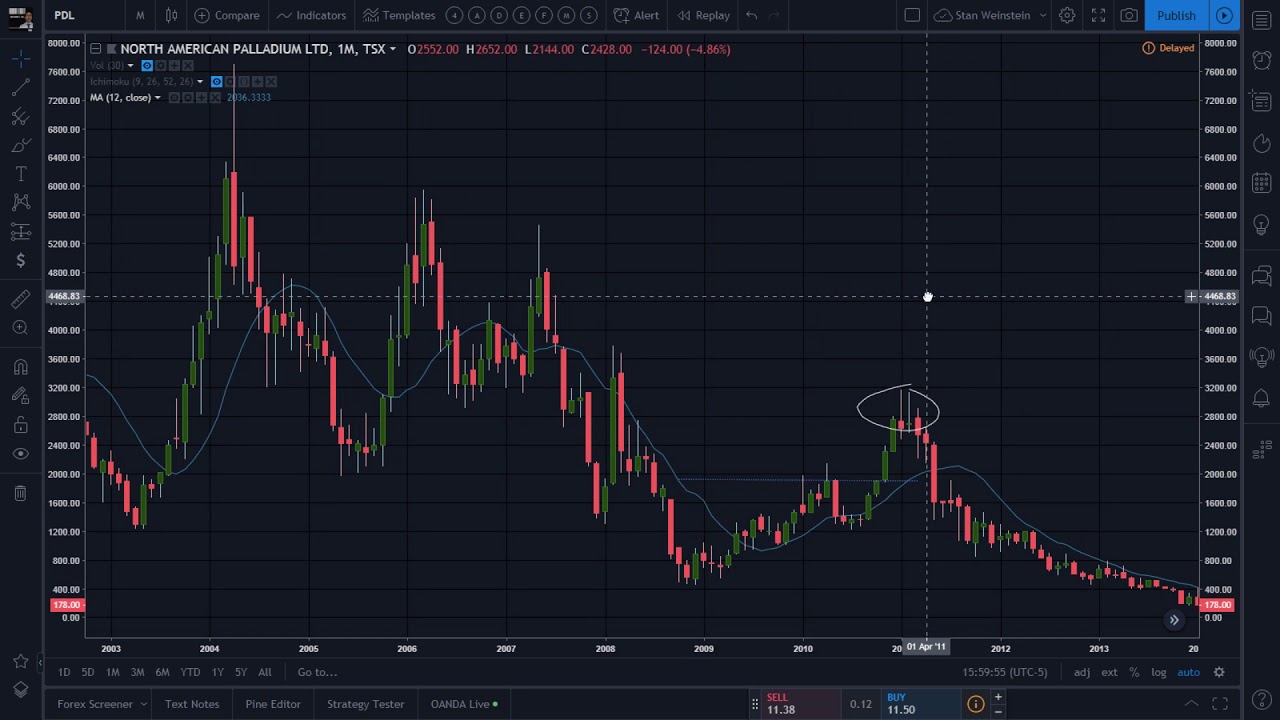
Secretwars #0259 – Stage 2 continuation for North American Palladium?
On November 15, 2018
Secretwars #0258 – Revisiting Aurora Cannabis, ending it’s Stage 2.
On November 13, 2018
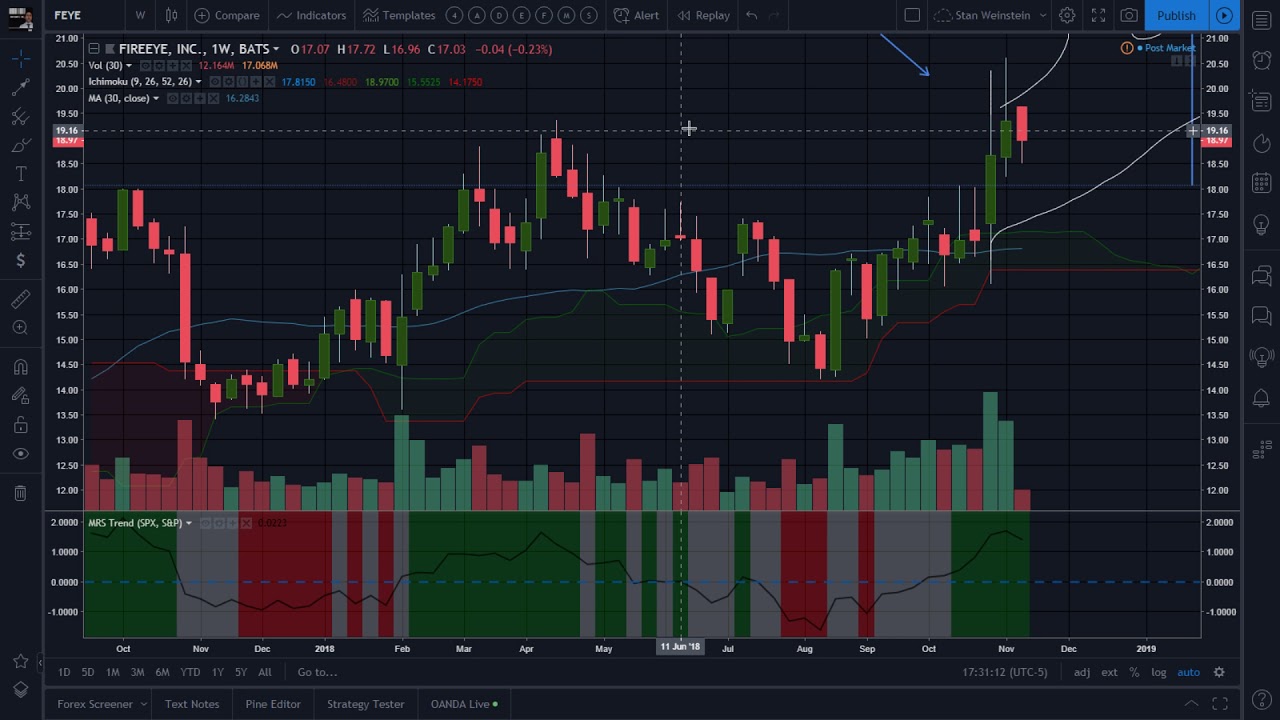
Secretwars #0257 – Quick look at Fireeye Inc., entering Stage 2.
On November 12, 2018
Secretwars #0256 – Markets Review: Semiconductors Industry deep dive!
On November 11, 2018
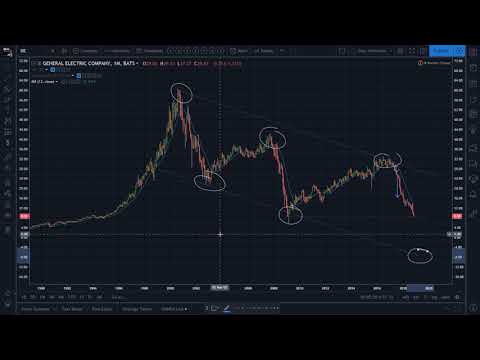
Secretwars #0255 – Revisiting General Electric Co. extending it’s Stage 4!
On November 10, 2018
Secretwars #0254 – Analog Devices to resume Stage 4 decline?
On November 9, 2018
Secretwars #0253 – Revisiting Tripadvisor, back in Stage 2!
On November 8, 2018
Secretwars #0252 – Markets Review: FTSE in Stage 4.
On November 8, 2018
Secretwars #0251 – Revisiting Tesla, now in an early Stage 2.
On November 6, 2018
Secretwars #0250 – Stage 2 in the works for Ensco?
On November 5, 2018
Secretwars #0249 – What’s up with Microsoft’s Stage 2?
On November 4, 2018
Secretwars #0248 – Markets Review: West Texas Oil in a Stage 3.
On November 3, 2018
Secretwars #0247 – Revisiting Amazon, entering Stage 3.
On November 2, 2018
Secretwars #0246 – Revisiting Apple with a Stage 2 slow down.
On November 1, 2018
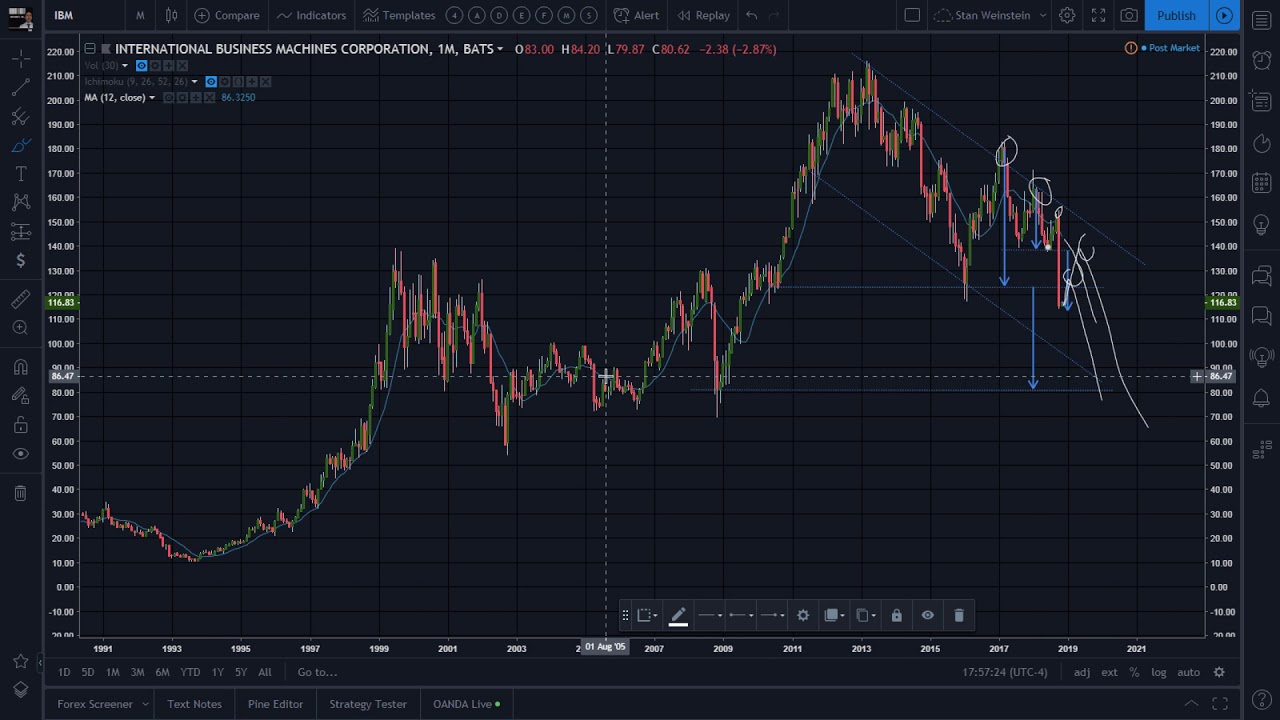
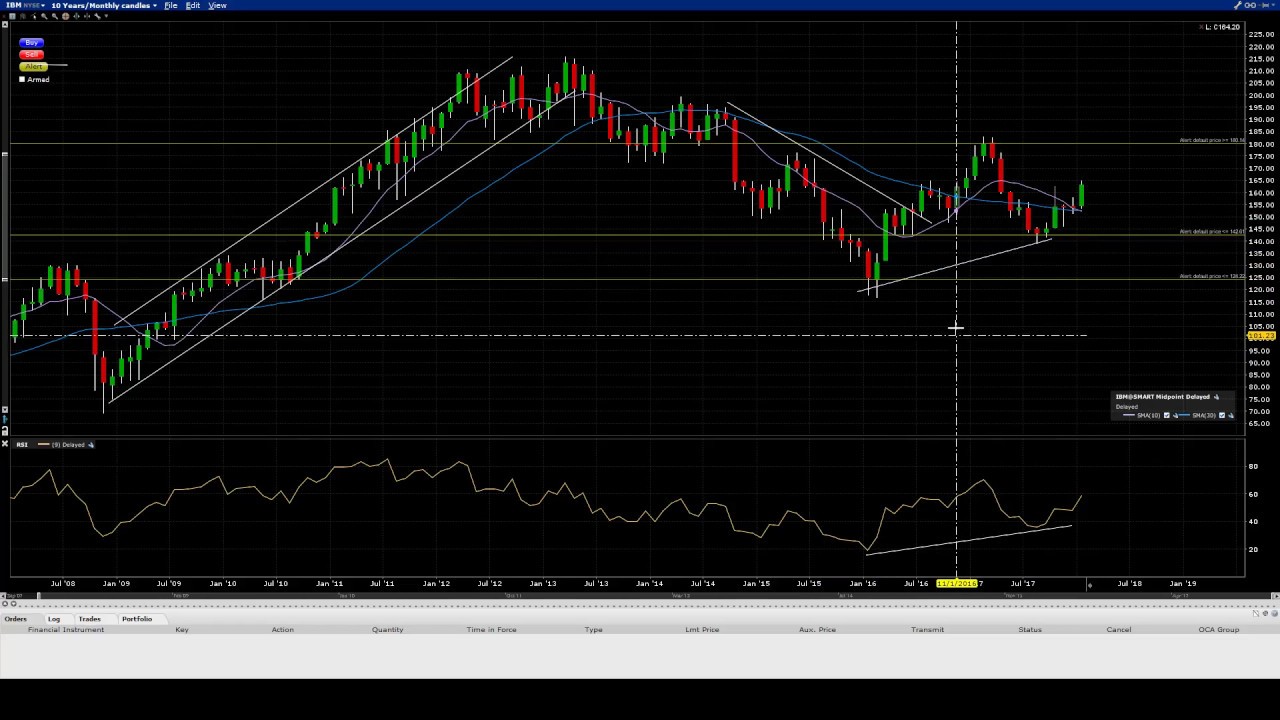
Secretwars #0245 – Revisiting IBM, continuing it’s Stage 4 decline!
On November 1, 2018
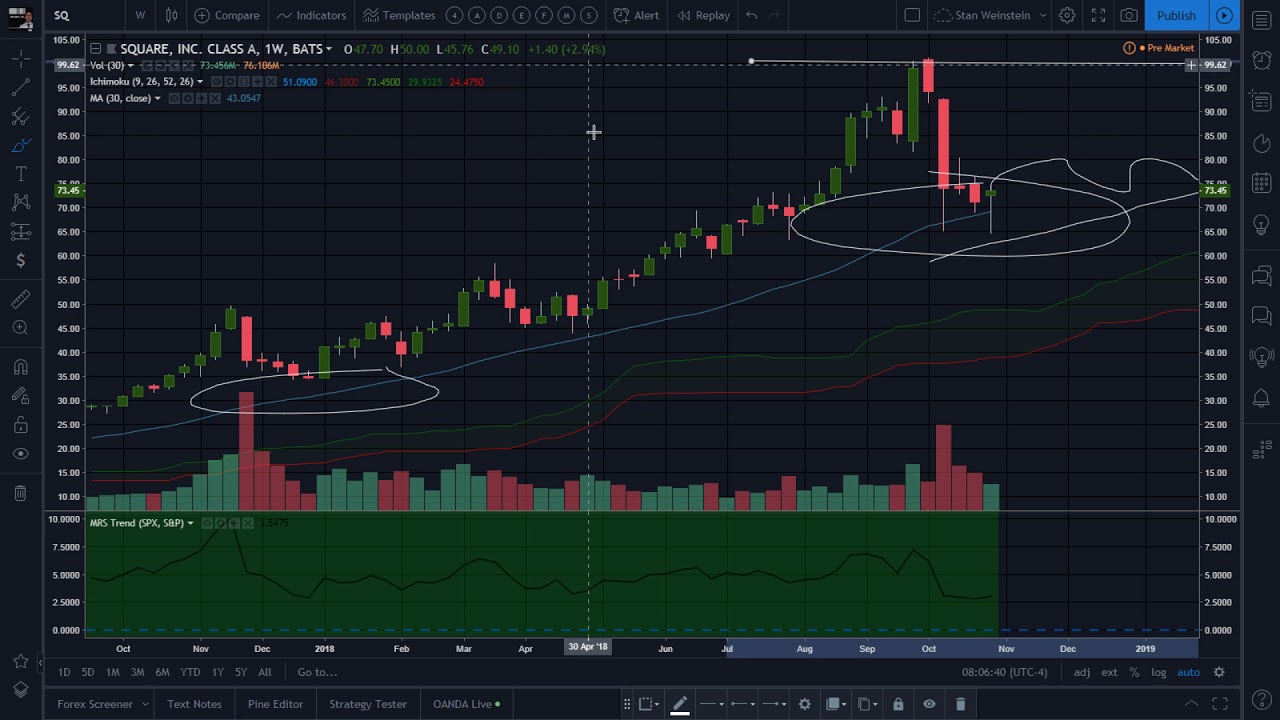
Secretwars #0244 – Square Inc. hard pullback in a Stage 2!
On October 30, 2018
Secretwars #0243 – Markets Review: A global index survey.
On October 29, 2018
Secretwars #0242 – Revisiting Google, on brink of collapse!
On October 28, 2018
Secretwars #0241 – Revisiting Alibaba in Stage 4 decline.
On October 27, 2018
Secretwars #0240 – Revisiting Walmart continuing Stage 2!
On October 26, 2018
Secretwars #0239 – Revisiting Toronto-Dominion Bank.
On October 25, 2018
Secretwars #0237 – Markets Review: S&P 500 still no meltdown.
On October 25, 2018
Secretwars #0238 – Embryonic Stage 2 for Barrick Gold!
On October 24, 2018
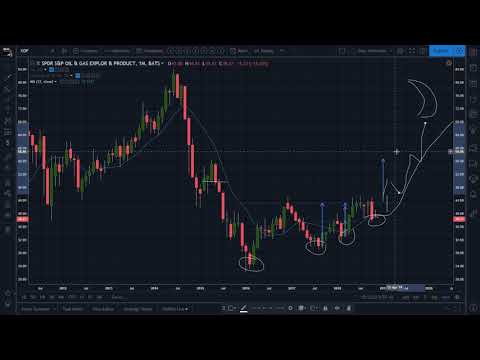
Secretwars #0236 – Revisiting SPDR S&P Oil & Gas Exploration & Prod
On October 23, 2018
Secretwars #0235 – Stage 4 ready for Citigroup, Inc.!
On October 22, 2018
Secretwars #0234 – Markets Review: S&P sector analysis.
On October 21, 2018
Secretwars #0233 – Revisiting Nvidia, ending it’s Stage 2.
On October 20, 2018
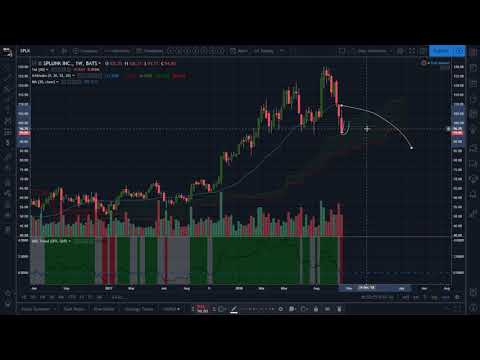
Secretwars #0232 – Revisiting Splunk entering in Stage 4!
On October 19, 2018
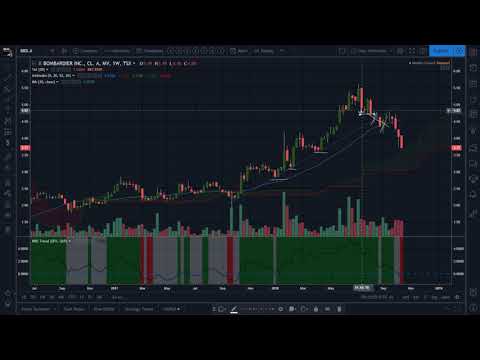
Secretwars #0231 – Revisiting Bombardier, now in Stage 4!
On October 18, 2018
Secretwars #0230 – Revisitng Canopy Growth & Aurora Cannabis!
On October 17, 2018
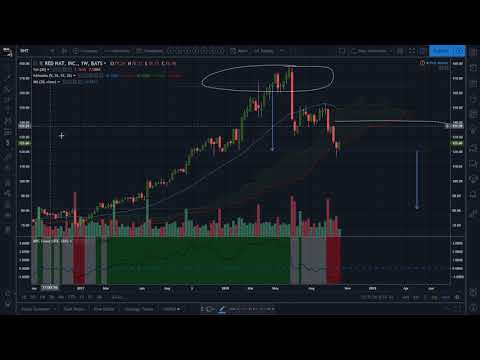
Secretwars #0229 – Revisiting Redhat, now in Stage 4 decline.
On October 16, 2018
Secretwars #0228 – Markets Review: Another Marijuana Index!
On October 15, 2018
Secretwars #0227 – Markets Review: SPDR S&P Transportation.
On October 14, 2018
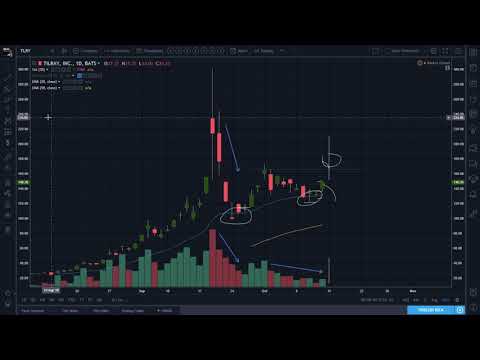
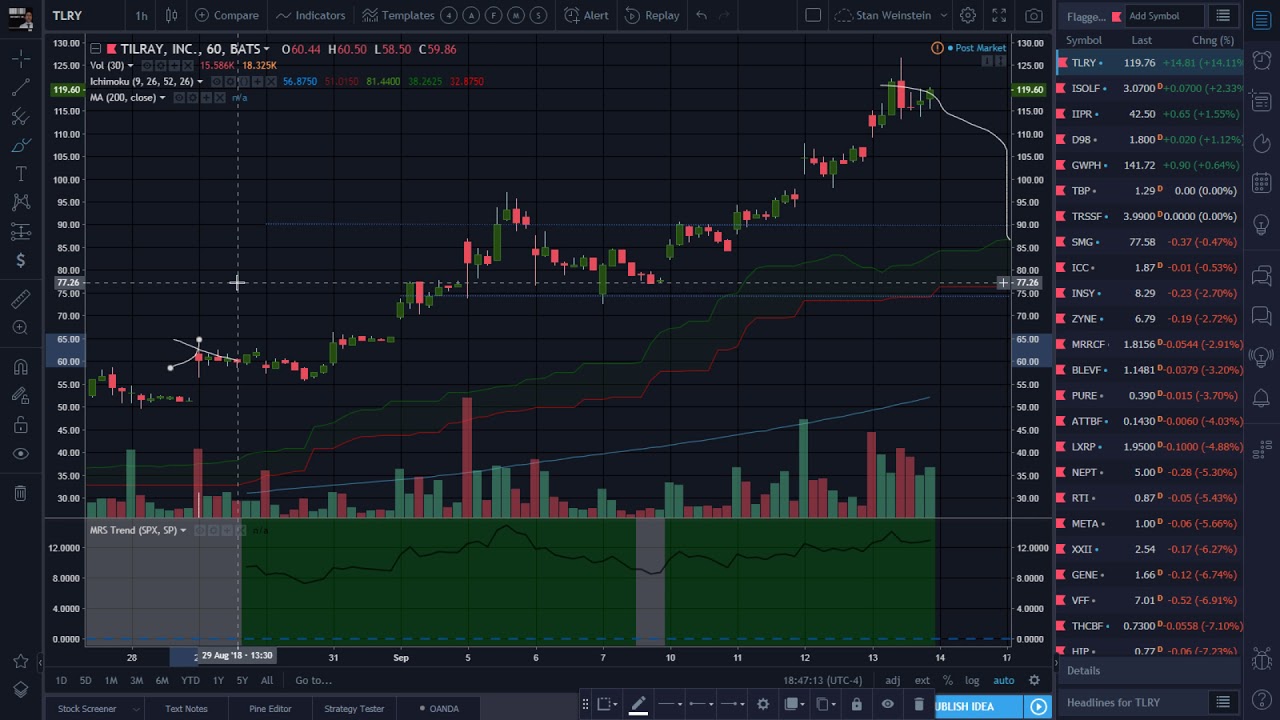
Secretwars #0226 – Revisiting the still curious case of Tilray, Inc.!
On October 13, 2018
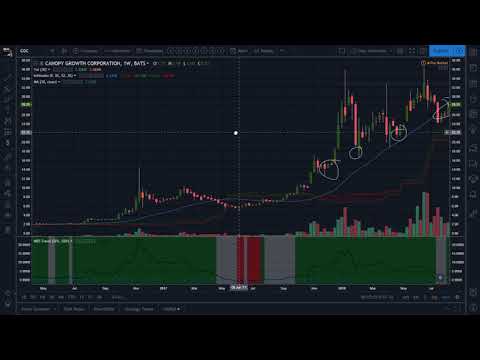
Secretwars #0225 – Revisiting Canopy Growth Corp. still in Stage 2
On October 12, 2018
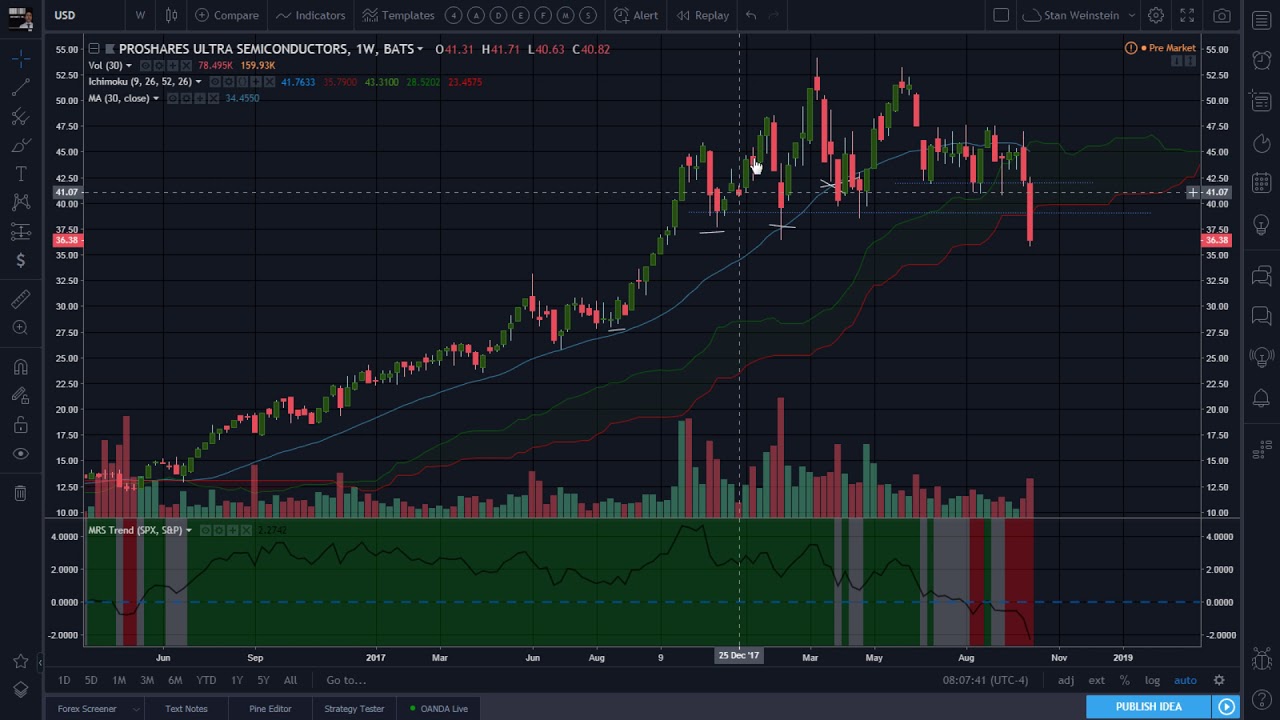
Secretwars #0224 – ProShares Ultra Semiconductors entering Stage 4.
On October 11, 2018
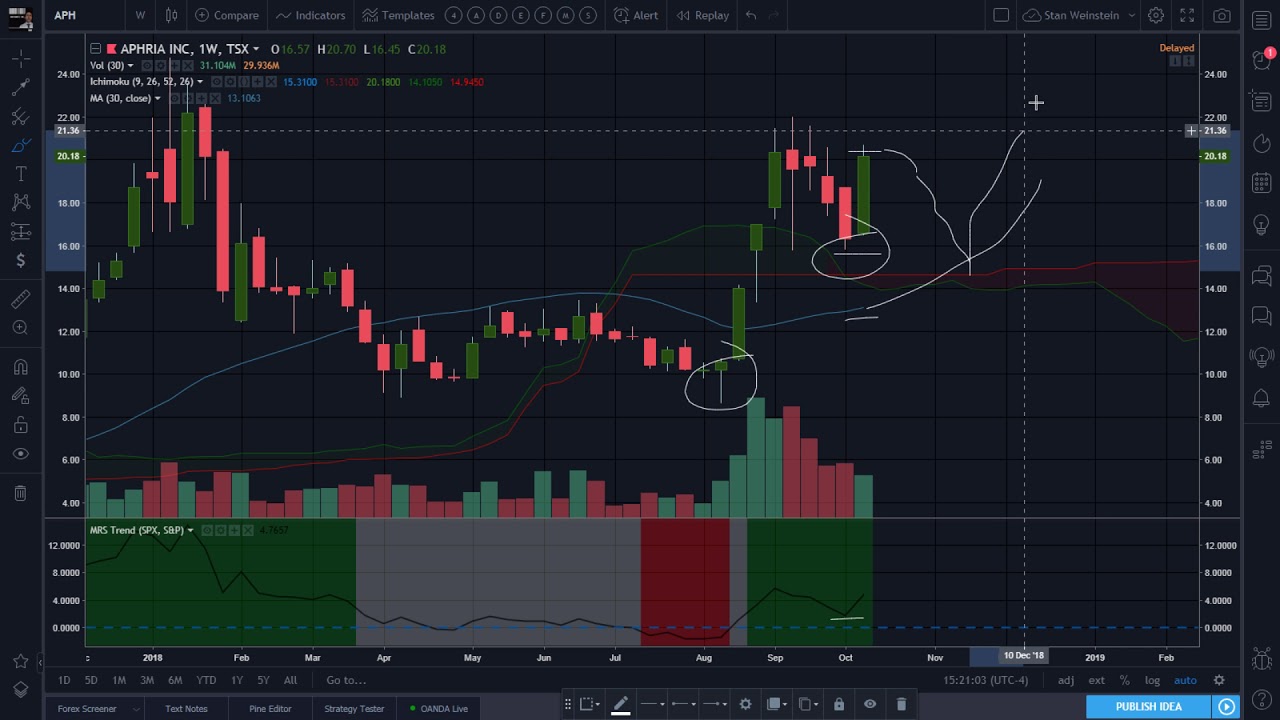
Secretwars #0223 – Revisiting Aphria Inc, confirming it’s Stage 2 advance.
On October 10, 2018
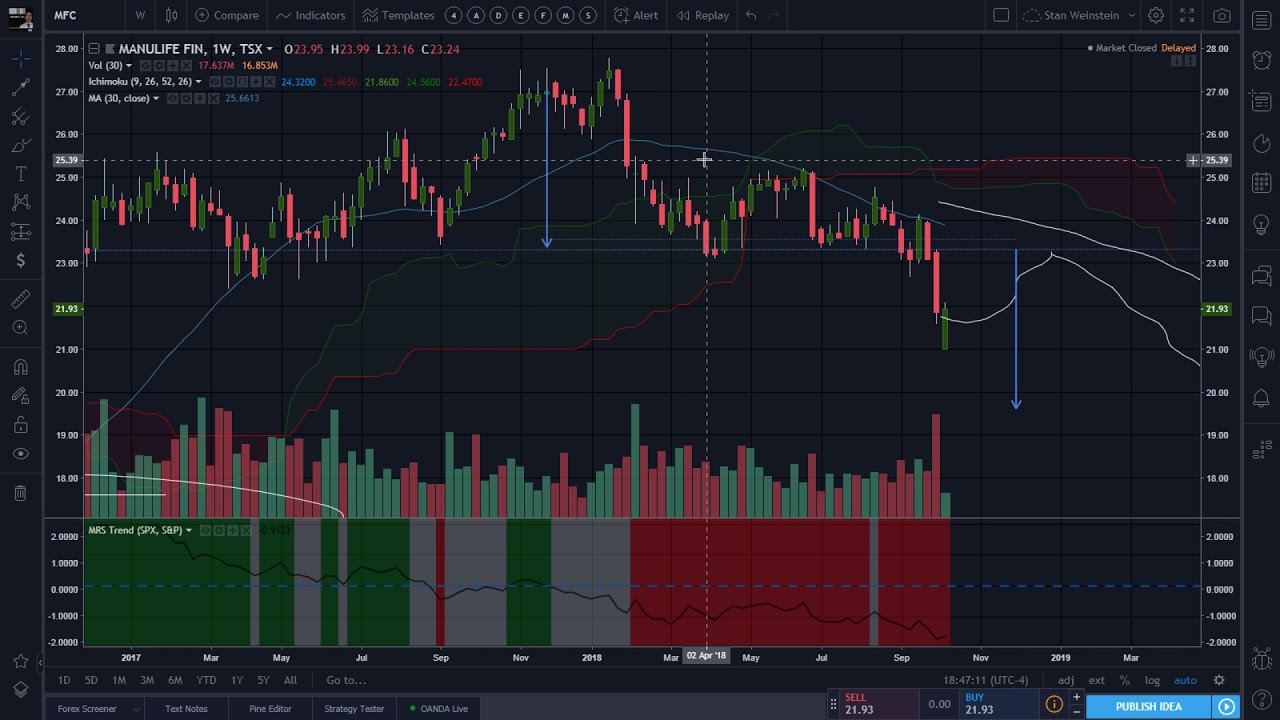
Secretwars #0222 – Revisiting Manulife Financial’s Stage 4 breakdown.
On October 9, 2018
Secretwars #0221 – Early Stage 4 breakdown for Arista Networks.
On October 8, 2018
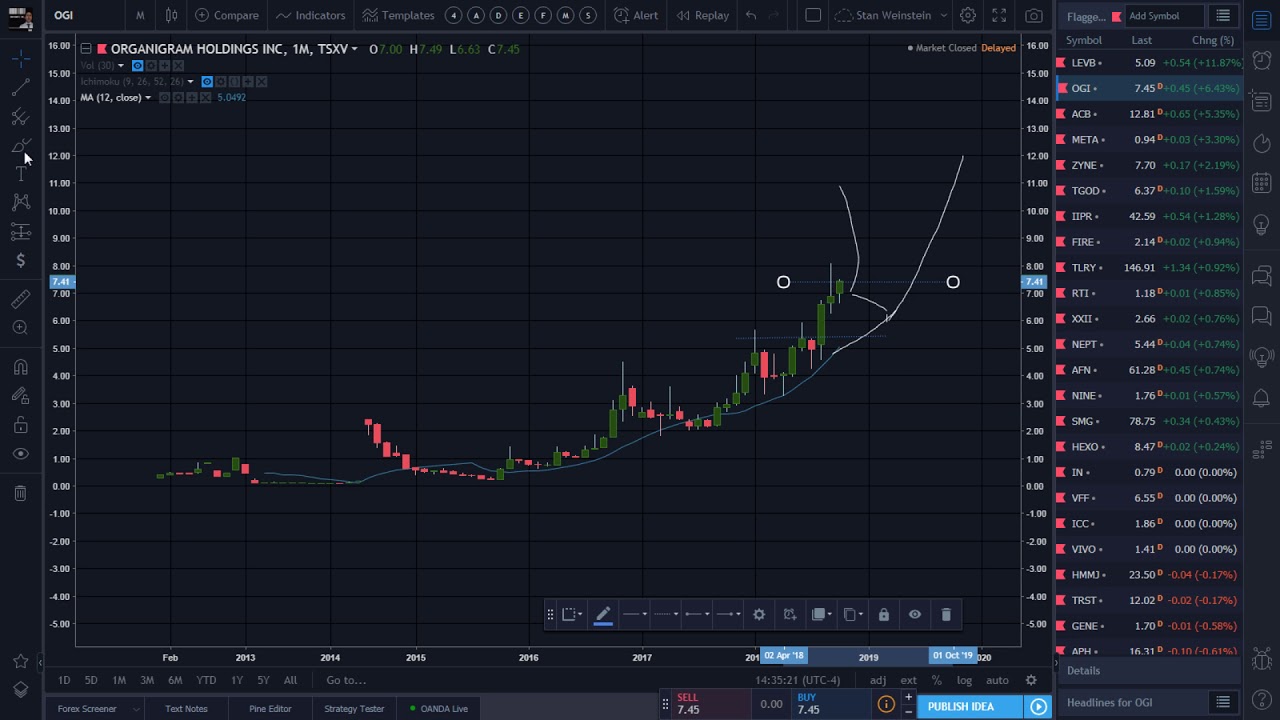
Secretwars #0220 – Revisiting Organigram Holdings Stage 2.
On October 7, 2018
Secretwars #0219 – Revisiting Facebook, now in Stage 4.
On October 6, 2018
Secretwars #0218 – Revisiting Aurora Cannabis, still in Stage 2
On October 5, 2018
Secretwars #0217 – Markets Review: SPDR S&P Homebuilders breaks down!
On October 4, 2018
Secretwars #0216 – Markets Review: Revisiting iShares 20+ Year Treasury Bond ETF.
On October 3, 2018
Secretwars #0215 – Markets Review: Revisiting Gold US Dollar.
On October 2, 2018
Secretwars #0214 – Markets Review: Copper still in Stage 4.
On October 1, 2018
Secretwars #0213 – Markets Review: Strong Stage 2 for Brent Crude Oil.
On September 30, 2018
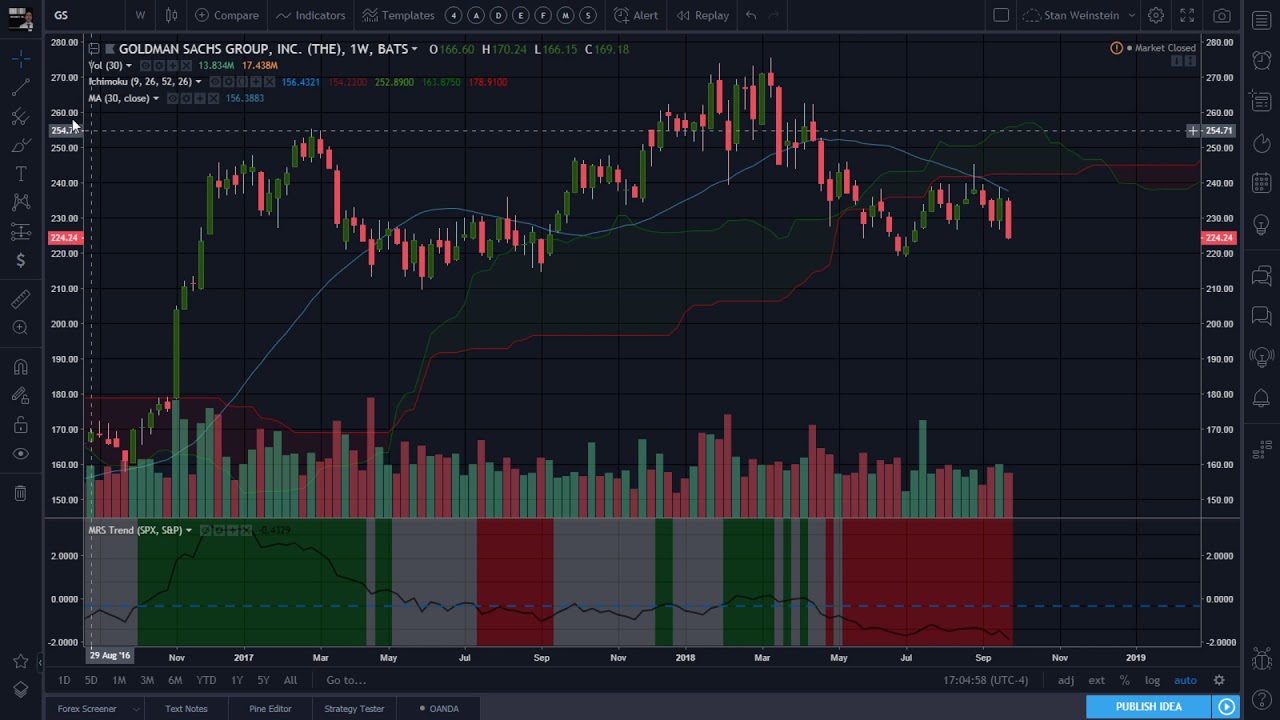
Secretwars #0212 – Goldman Sachs joining the Stage 4 party!
On September 29, 2018
Secretwars #0211 – Morgan Stanley breaking down in Stage 4!
On September 28, 2018
Secretwars #0210 – Which way will Walmart’s Stage 3 go?
On September 28, 2018
Secretwars #0209 – Revisiting Seabridge Gold Inc, now leading a Stage 2!
On September 26, 2018
Secretwars #0208 – Markets Review: 3 out of 7 indicies already in Stage 4!
On September 25, 2018
Secretwars #0207 – Namaste Technologies Inc. in a Stage 2!
On September 24, 2018
Secretwars #0206 – Revisiting Gibson Energy, Stage 2 confirmed!
On September 23, 2018
Secretwars #0205 – Insys Therapeutics looking upwards at Stage 2!
On September 22, 2018
Secretwars #0204 – Early Stage 2 for Hempco Food & Fiber Inc.
On September 21, 2018
Secretwars #0203 – Stage 2 continuation for GW Pharmaceuticals.
On September 20, 2018
Secretwars #0202 – Markets Review: 10 Year U.S. Treasury Notes in a Stage 4!
On September 18, 2018
Secretwars #0201 – Embryonic Stage 2 for Delta 9 Cannabis.
On September 18, 2018
Secretwars #0200 – Markets Review: Germany 30 feel’n doom & gloom!
On September 16, 2018
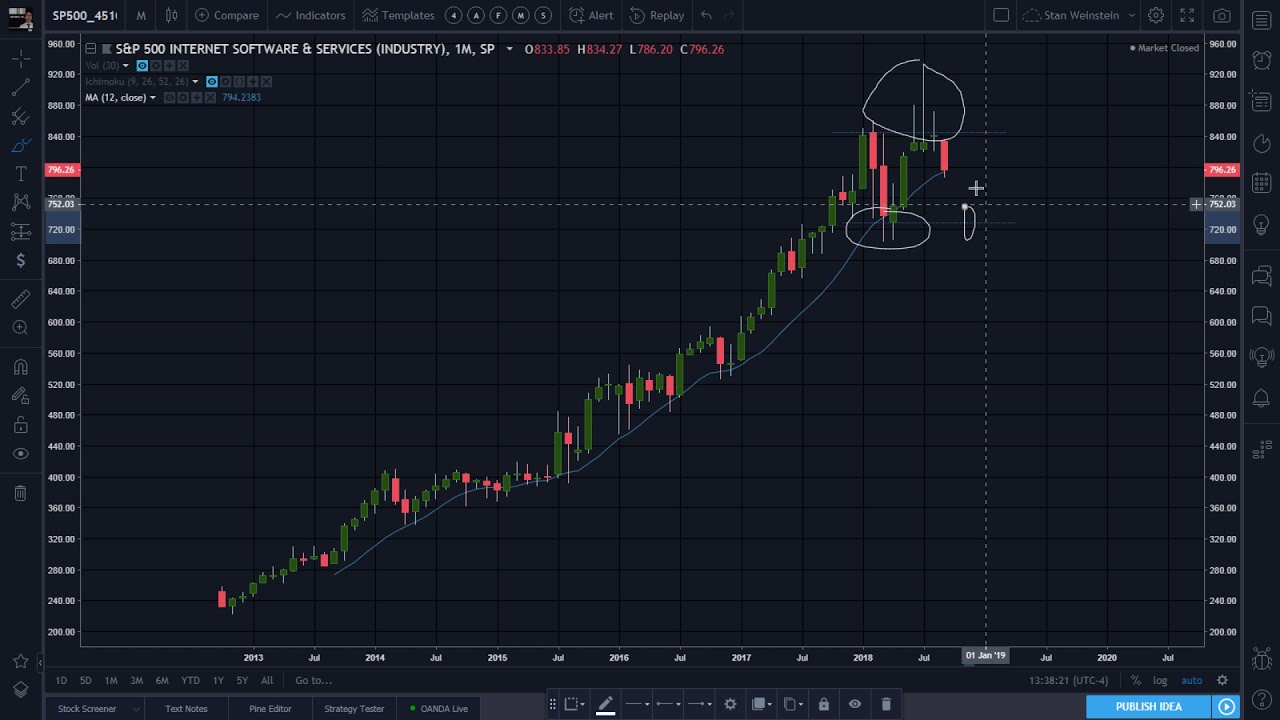
Secretwars #0199 – Markets Review: S&P 500 Internet Software & Services Industry
On September 16, 2018
Secretwars #0198 – Stage 4 just started for Twitter!
On September 15, 2018
Secretwars #0197 – A Stage 2 revival for TerraForm Power Inc.?
On September 14, 2018
Secretwars #0196 – The curious case of Tilray, Inc..
On September 13, 2018
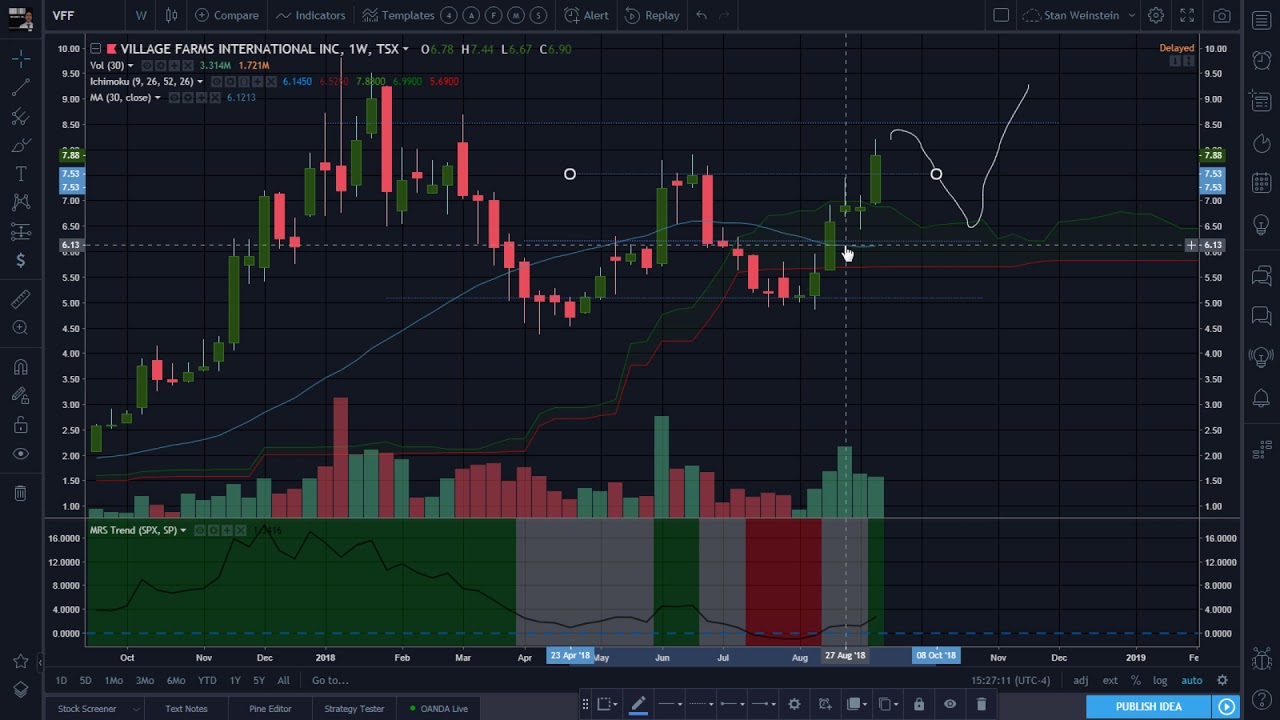
Secretwars #0195 – Stage 2 breakout for Village Farms Int’L?
On September 12, 2018
Secretwars #0194 – ICC Labs Inc. Stage 2 breakout ends with a buyout!
On September 11, 2018
Secretwars #0193 – Embryonic Stage 2 Emerald Health Therapeutics?
On September 10, 2018
Secretwars #0192 – Forex Review: New Zealand Dollar vs Japanses Yen
On September 9, 2018
Secretwars #0191 – WeedMD on a Stage 2 run?
On September 8, 2018
Secretwars #0190 – Markets Review: Europe 50 and more!
On September 7, 2018
Secretwars #0189 – Markets Review: A Social Media Index!
On September 6, 2018
Secretwars #0188 – Leju Holdings in an early Stage 2!
On September 5, 2018
Secretwars #0187 – When will The Supreme Cannabis Company Inc. enter Stage 2?
On September 4, 2018
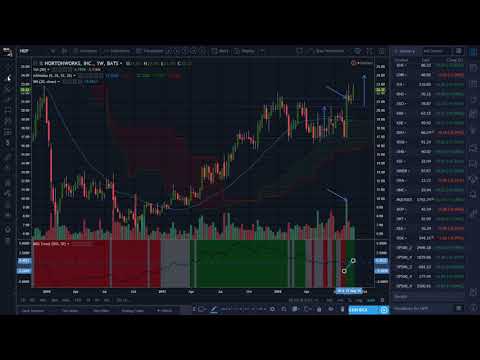
Secretwars #0186 – Hortonworks, Inc. rolling a nice Stage 2!
On September 3, 2018
Secretwars #0185 – Histogenics entering Stage 2!
On September 2, 2018
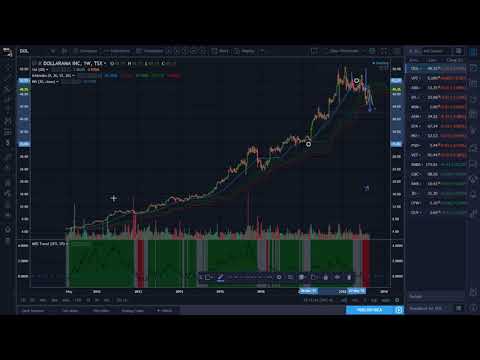
Secretwars #0184 – Revisiting Dollarama, still in Stage 4 territory.
On September 1, 2018
Secretwars #0183 – Markets Review: A Marijuana Index!
On August 31, 2018
Secretwars #0182 – Still in Stage 2 for Organigram Holdings!
On August 30, 2018
Secretwars #0181 – Aurora Cannabis turning into a Stage 2?
On August 29, 2018
Secretwars #0180 – Revisiting the Hydropothecary Corp. with more Stage 2?
On August 28, 2018
Secretwars #0179 – Stage 4 for BCE Inc., since Jan ’18!
On August 27, 2018
Secretwars #0178 – Aphria Inc. to follow peers in Stage 2?
On August 26, 2018
Secretwars #0177 – Cronos Group Inc. in a Stage 2 breakout!
On August 25, 2018
Secretwars #0176 – Enbridge Inc. tempting an early Stage 2 breakout!
On August 24, 2018
Secretwars #0175 – Splunk looks for a Stage 2 continuation breakout!
On August 23, 2018
Secretwars #0174 – Stage 2 continuation for VMware, Inc.?
On August 22, 2018
Secretwars #0173 – Canopy Growth Corp. in a choppy Stage 2!
On August 21, 2018
Secretwars #0172 – Intel Corp. ready for a Stage 4 breakdown?
On August 20, 2018
Secretwars #0171 – Cisco aiming for a Stage 2 continuation!
On August 19, 2018
Secretwars #0170 – Markets Review: FANG
On August 18, 2018
Secretwars #0169 – Revisiting Micron Technology Inc., now edging a Stage 4!
On August 17, 2018
Secretwars #0168 – Markets Review: The World’s End!
On August 16, 2018
Secretwars #0167 – Forex Review: Japanese Yen Futures
On August 15, 2018
Secretwars #0166 – Energy Fuels Inc. still riding a strong Stage 2!
On August 14, 2018
Secretwars #0165 – Stage 2 for SPDR S&P Pharmaceuticals!
On August 13, 2018
Secretwars #0164 – Potential Stage 2 for Ag Growth Int’L Inc.
On August 12, 2018
Secretwars #0163 – Forex Review: Mexican Peso Futures
On August 11, 2018
Secretwars #0162 – Forex Review: Swiss Franc Futures
On August 10, 2018
Secretwars #0161 – Forex Review: Australian Dollar Futures
On August 9, 2018
Secretwars #0160 – Forex Review: New Zealand Dollar vs Canadian Dollar
On August 8, 2018
Secretwars #0159 – Forex Review: New Zealand Dollar vs U.S. Dollar
On August 7, 2018
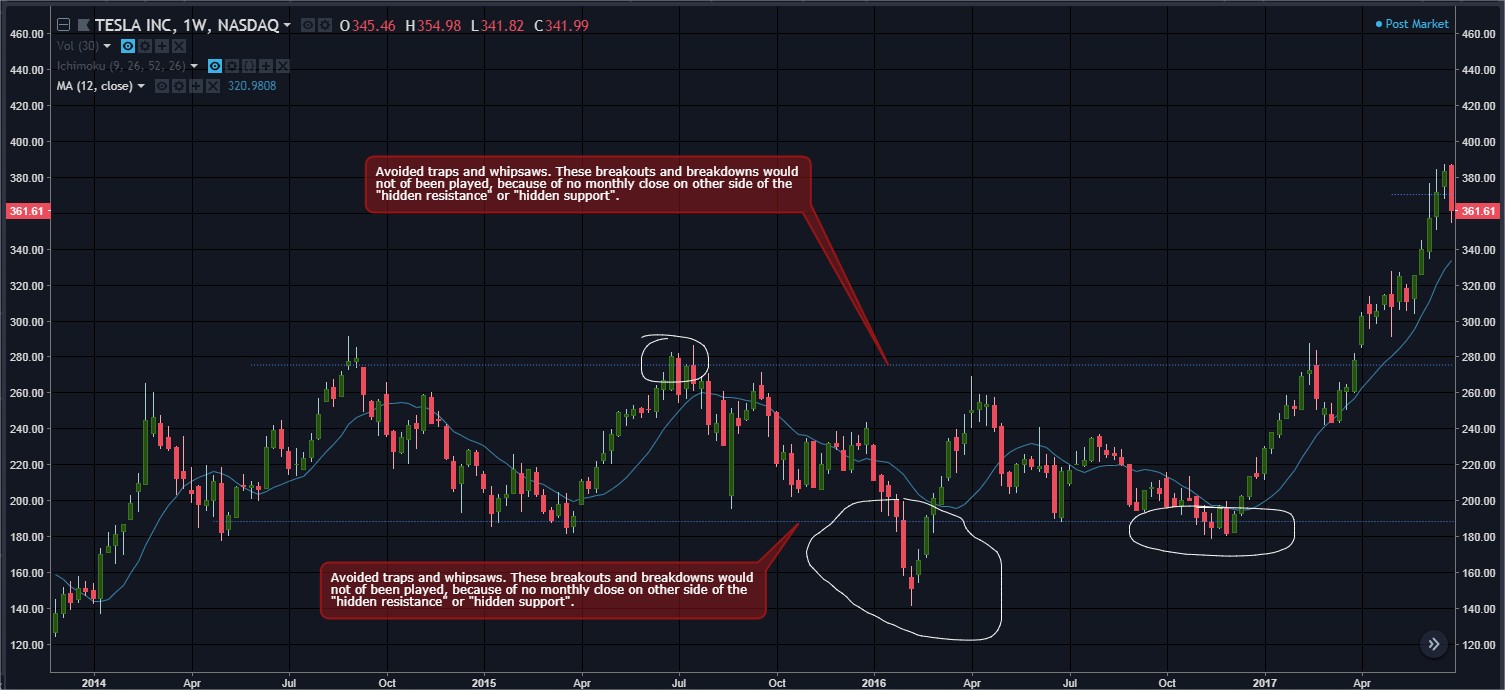
Using Tesla to demonstate the importance of “hidden resistance” and “hidden support”
On August 7, 2018
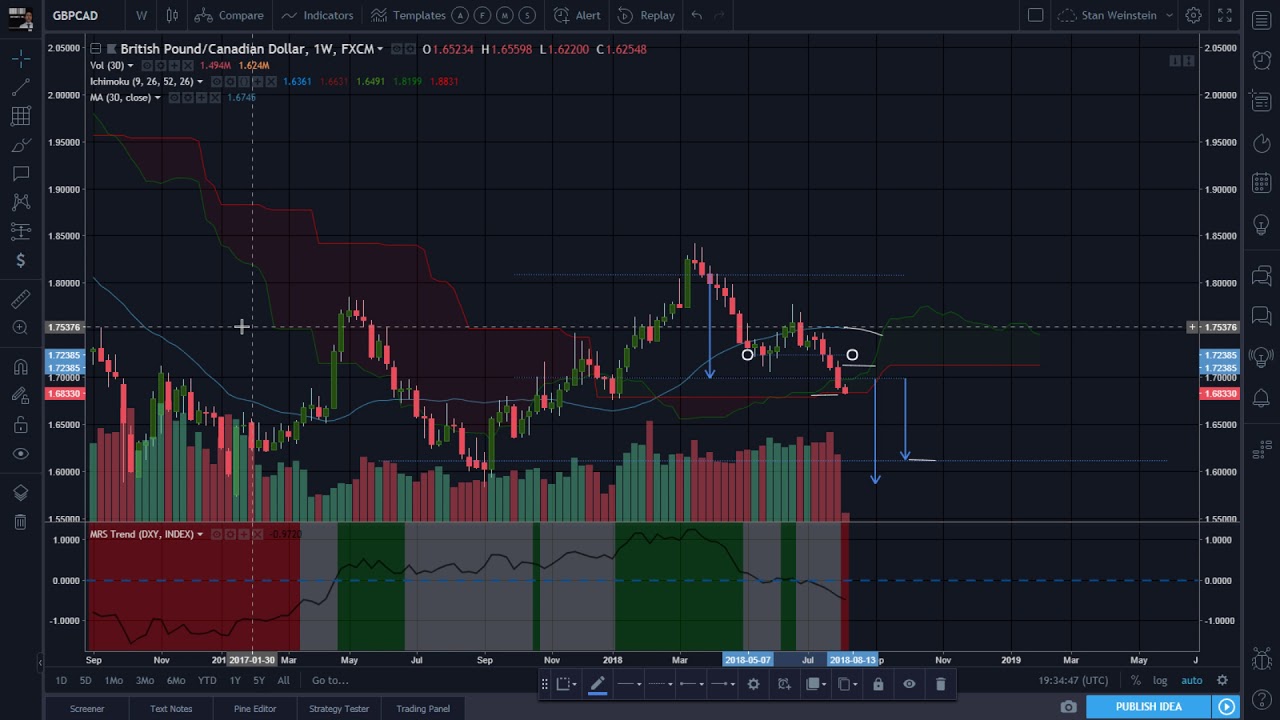
Secretwars #0158 – Forex Review: Great British Pound vs Canadian Dollar
On August 6, 2018
Secretwars #0157 – Forex Review: Euro vs U.S. Dollar
On August 5, 2018
Secretwars #0156 – Stage 4 in progress for the Gold U.S. Dollar.
On August 4, 2018
Secretwars #0155 – SPDR S&P China entering Stage 4 decline.
On August 3, 2018
Secretwars #0154 – Revisiting Gibson Energy, now poised to breakout!
On August 2, 2018
Secretwars #0153 – Markets Review: Sector Rotation (2016-2018)
On August 1, 2018
Secretwars #0152 – Markets Review: Sector Rotation (2007-2008)
On July 31, 2018
Secretwars #0151 – Markets Review: US vs The World
On July 30, 2018
Secretwars #0150 – Leading Stage 2 with American Express Company?
On July 29, 2018
Secretwars #0149 – Precursor Stage 4 for Dollarama Inc?
On July 28, 2018
Secretwars #0148 – Echo Global Logistics, Inc. leading into Stage 2?
On July 27, 2018
Secretwars #0147 – Markets Review: NYSE Advance/Decline
On July 26, 2018
Secretwars #0146 – Markets Review: US & Canadian
On July 25, 2018
Secretwars #0145 – Eli Lilly & Co. really wants that Stage 2 breakout!
On July 24, 2018
Secretwars #0144 – Envestnet, Inc. in a Stage 2 cont. breakout!
On July 23, 2018
Secretwars #0143 – Bitcoin currently in a Stage 4 breakdown…
On July 22, 2018
Secretwars #0142 – Stage 4 in progress for iShares FTSE China 25 Index Fund.
On July 21, 2018
Secretwars #0141 – Williams Partners L.P. ready for a Stage 2.
On July 20, 2018
Secretwars #0140 – Stage 2 breakout for DCP Midstream Partners!
On July 19, 2018
Secretwars #0139 – First Nat’L Fin Corp threatening a Stage 2 breakout!
On July 18, 2018
Secretwars #0138 – Avid Biosciences entering Stage 2 territory!
On July 17, 2018
Secretwars #0137 – Still in a Stage 2 for Netflix, with exit signs!
On July 16, 2018
Secretwars #0136 – Stage 2 breakout for ZincX Resources Corp.!
On July 15, 2018
Secretwars #0135 – Pine Cliff Energy wants to enter Stage 2!
On July 14, 2018
Secretwars #0134 – Early Stage 2 in the works for Pandora Media.
On July 13, 2018
Secretwars #0133 – Stage 2 continuation breakout for Transocean Ltd.?
On July 12, 2018
Secretwars #0132 – Reitmans Canada exploring a Stage 2 entry.
On July 11, 2018
Secretwars #0131 – Revisiting Canadian Natural Resources Limited.
On July 10, 2018
Secretwars #0130 – Advancing Stage 2 for Largo Resources Ltd.
On July 9, 2018
Secretwars #0129 – BioScrip Inc. ready to explode in a Stage 2!
On July 8, 2018
Secretwars #0128 – Early Stage 2 entry Greenbrier Companies!
On July 7, 2018
Secretwars #0127 – Niko Resources Ltd tempting a Stage 2 entry!
On July 6, 2018
Secretwars #0126 – McDonald’s Corp. ready for a Stage 4 drop!
On July 5, 2018
Secretwars #0125 – Early Stage 2 for Peregrine Diamonds?
On July 4, 2018
Secretwars #0124 – Agnico-Eagle Mines Ltd. trying to enter Stage 2 territory!
On July 3, 2018
Secretwars #0123 – Stage 2 continuation breakout for Transglobe Energy Corp!
On July 2, 2018
Secretwars #0122 – Stage 2 in progress for Gear Energy Ltd!
On July 1, 2018
Secretwars #0121 – Early Stage 2 breakout Kellogg Company!
On June 30, 2018
Secretwars #0120 – Reunion Gold Corp looking for a Stage 2 entry.
On June 29, 2018
Secretwars #0119 – Revisiting Energy Fuels Inc., exploding in a Stage 2!
On June 28, 2018
Secretwars #0118 – Tanzanian Royalty in an early Stage 2.
On June 27, 2018
Secretwars #0117 – Stage 2 in progress for Vivint Solar!
On June 26, 2018
Secretwars #0116 – Will Hemisphere Energy Corporation confirm it’s Stage 2?
On June 25, 2018
Secretwars #0115 – Upcoming Stage 2 breakout for Seabridge Gold?
On June 24, 2018
Secretwars #0114 – Aptevo Therapeutics rocking a solid Stage 2!
On June 23, 2018
Secretwars #0113 – Nice Stage 2 for Fortuna Silver Mines.
On June 22, 2018
Secretwars #0112 – Rocky Stage 2 for Hydropothecary Corp.
On June 21, 2018
Secretwars #0111 -Tripadvisor Inc. in a constructive Stage 2!
On June 20, 2018
Secretwars #0110 – More Stage 2 action for Array BioPharma!
On June 19, 2018
Secretwars #0109 – RadNet, Inc. looking for a Stage 2 continuation breakout!
On June 18, 2018
Secretwars #0108 – Stage 2 playing out for Verastem, Inc.
On June 17, 2018
Secretwars #0107 – Stage 2 continuation breakout for SodaStream?
On June 16, 2018
Secretwars #0106 – Revisiting Canadian National Railway Co., now in a Stage 2!
On June 15, 2018
Secretwars #0105 – Alacer Gold Corp. solidifying it’s current Stage 2
On June 14, 2018
Secretwars #0104 – K92 Mining Inc. tempting another Stage 2 continuation breakout!
On June 13, 2018
Secretwars #0103 – Revisting Tesla, now tempting a Stage 2 breakout!
On June 12, 2018
Secretwars #0102 – Athabasca Oil Sand moving in a Stage 2.
On June 11, 2018
Secretwars #0101 – Advancing Stage 2 for Aptose Biosciences Inc.
On June 10, 2018
Secretwars #0100 – Natural Grocers already in a Stage 2.
On June 9, 2018
Secretwars #0099 – Airboss Of America Corp aiming a Stage 2 continuation breakout!
On June 8, 2018
Secretwars #0098 – 3D Systems Corporation building it’s Stage 2!
On June 7, 2018
Secretwars #0097 – Stage 2 breakout for Polarityte Inc.
On June 6, 2018
Secretwars #0096 – Sogou Inc’s first ever Stage 2 breakout!
On June 5, 2018
Secretwars #0095 – Baozun continuing it’s Stage 2!
On June 4, 2018
Secretwars #0094 – Momo Inc. confirmed Stage 2 breakout!
On June 3, 2018
Secretwars #0093 – Enterprise Bancorp Inc. already in a Stage 2!
On June 2, 2018
Secretwars #0092 – On Deck Capital already advancing in a Stage 2.
On June 1, 2018
Secretwars #0091 – Stage 2 continuation breakout for Jack Henry & Associates Inc.?
On May 31, 2018
Secretwars #0090 – Altura Energy blasts into a Stage 2 breakout!
On May 30, 2018
Secretwars #0089 – JD.com creeping in Stage 4 territory!
On May 29, 2018
Secretwars #0088 – Destination Maternity Corporation in a Stage 2 breakout!
On May 28, 2018
Secretwars #0087 – Stage 2 in progress for Computer Programs & Systems Inc.!
On May 27, 2018
Secretwars #0086 – Tantech Holdings needs some help to breakout!
On May 26, 2018
Secretwars #0085 – Healthy Stage 2 for Capstone Turbine Corp.
On May 25, 2018
Secretwars #0084 – Imminent Stage 2 breakout for Goldcorp Inc.?
On May 24, 2018
Secretwars #0083 – Stage 1 in progress for Computer Modelling Grp Ltd.
On May 23, 2018
Secretwars #0082 – Micron Technology Inc. continuing it’s Stage 2.
On May 22, 2018
Secretwars #0081 -Vermilion Energy Inc. breakout in Stage 2!
On May 21, 2018
Secretwars #0080 – Fossil, Inc. continues to build in a Stage 2!
On May 20, 2018
Secretwars #0079 – Cato Corp giving signs of a Stage 2 on the way!
On May 19, 2018
Secretwars #0078 – Bonterra Energy Corp itching to enter a Stage 2 breakout!
On May 18, 2018
Secretwars #0077 – Advancing Stage 2 for SPDR S&P Oil & Gas Exploration & Prod
On May 17, 2018
Secretwars #0076 – Stage 4 in progress for iShares 20+ Year Treasury Bond ETF
On May 16, 2018
Secretwars #0075 – Touchstone Exploration Inc. breaking out in a Stage 2.
On May 15, 2018
Secretwars #0074 – A very possible Stage 2 breakout for Marine Products Corp.
On May 14, 2018
Secretwars #0073 – Carmanah Tech Corp continuing a Stage 2 breakout!
On May 13, 2018
Secretwars #0072 – Promising Stage 2 for Torc Oil And Gas LTD!
On May 12, 2018
Secretwars #0071 – Revisiting Facebook, now poised for a Stage 2 breakout!
On May 11, 2018
Secretwars #0070 – Air Canada about to fly in a Stage 4 downfall!
On May 10, 2018
Secretwars #0069 – Electronic Arts Inc. Stage 2 is in the game!
On May 9, 2018
Secretwars #0068 – Revisiting Wheaton Precious Metals Corp.
On May 8, 2018
Secretwars #0067 – Stage 2 breakout in progress for International Tower Hill Mines Ltd.
On May 7, 2018
Secretwars #0066 – Confirmed Stage 2 breakout for Chuy’s Holdings, Inc.
On May 6, 2018
Secretwars #0065 – Stage 2 continuation breakout for Glu Mobile Inc.
On May 5, 2018
Secretwars #0064 – Pason Systems Inc breaks out in a Stage 2!
On May 4, 2018
Secretwars #0063 – Continuation Stage 2 breakout for Calfrac Well!
On May 3, 2018
Secretwars #0062 – Revisiting IBM, Stage 4 breakdown in progress!
On May 2, 2018
Secretwars #0061 – EnWave Enegry Corp already in a Stage 2
On May 1, 2018
Secretwars #0060 – Getting ready for a Nuvista Energy Stage 2 breakout!
On April 30, 2018
Secretwars #0059 – Gibson Energy Inc. working it’s Stage 1.
On April 29, 2018
Secretwars #0058 – When will Teucrium Wheat Fund breakout?
On April 28, 2018
Secretwars #0057 – Is Goldcorp tracing out a Stage 1 bottom?
On April 27, 2018
Secretwars #0056 – Wajax Corp. wants a Stage 2 breakout!
On April 26, 2018
Secretwars #0055 – From stage 3 to Stage 2 for Excelsior Mining Corp!
On April 25, 2018
Secretwars #0054 – Revisiting Apple’s current Stage 3.
On April 24, 2018
Secretwars #0053 – Blackpearl Res Inc. sailing into a Stage 2 breakout!
On April 23, 2018
Secretwars #0052 – Canacol Energy prepping a Stage 2 breakout.
On April 22, 2018
Secretwars #0051 – Energy Fuels Inc. is closing in on a Stage 2 breakout.
On April 21, 2018
Secretwars #0050 – Aveda Transport. & Energy jumping in a Stage 2 breakout!
On April 20, 2018
Secretwars #0049 – Meg Energy Corp. in a Stage 2 breakout!
On April 19, 2018
Secretwars #0048 – Abraxas Petroleum Corp. in a Stage 2 breakout now!
On April 18, 2018
Secretwars #0047 – Stage 2 breakout just starting for Tamarack Valley Energy Ltd.
On April 17, 2018
Secretwars #0046 – Stage 2 approaching for Wheaton Precious Metals Corp.
On April 16, 2018
Secretwars #0045 – IBM consolidates in a Stage 1
On April 15, 2018
Secretwars #0044 – Suncor Energy in a choppy Stage 2
On April 14, 2018
Secretwars #0043 – Cenovus Energy priming a Stage 2 breakout!
On April 13, 2018
Secretwars #0042 – Manulife Financial Corp ready for a Stage 4 breakdown!
On April 12, 2018
Secretwars #0041 – Aiming for Canadian National Resources Stage 2 breakout!
On April 11, 2018
Secretwars #0040 – Early Stage 2 for PowerShares DB Oil!
On April 10, 2018
Secretwars #0039 – Revisiting Encana Corp’s possible Stage 2
On April 9, 2018
Secretwars #0038 – Looking at a possible Stage 2 for Teucrium Soybean
On April 8, 2018
Secretwars #0037 – Revisiting Ambarella, Inc. now entering Stage 4 territory!
On April 7, 2018
Secretwars #0036 – Stage 4 for SPDR Barclays High Yield Bond ETF
On April 6, 2018
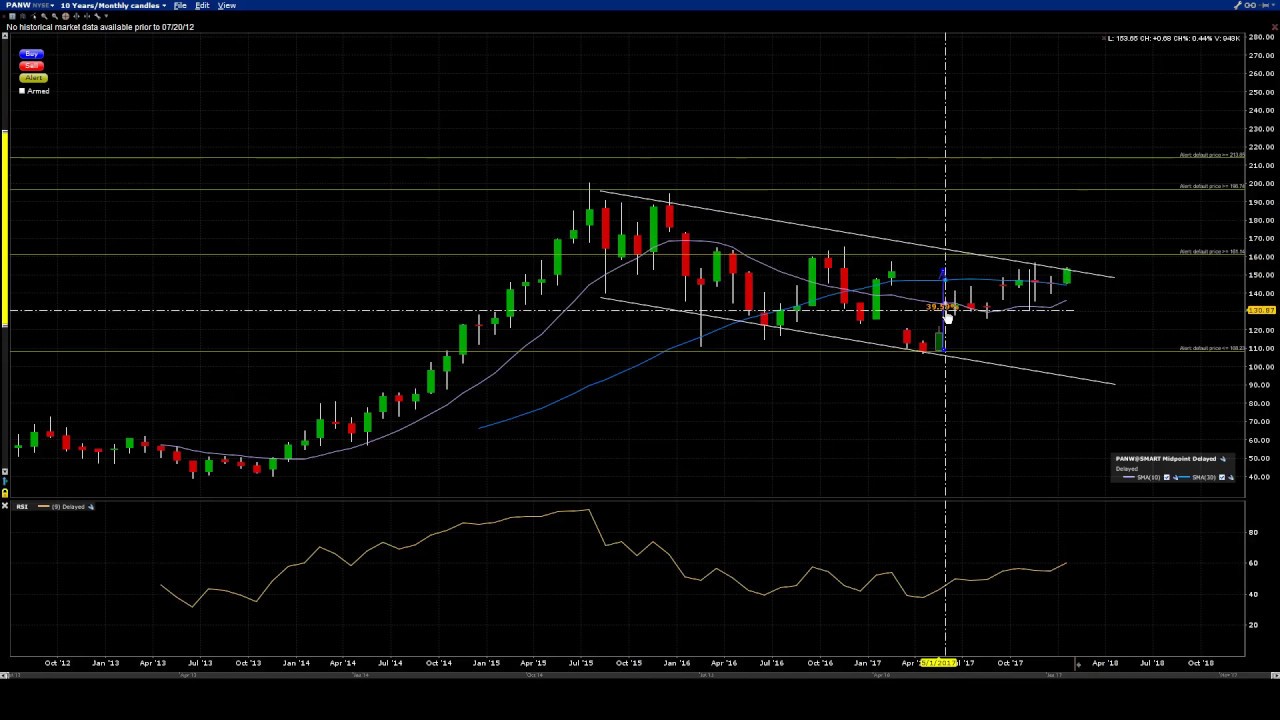
Secretwars #0035 – Stage 2 continuation breakout for Palo Alto Networks Inc.
On April 5, 2018
Secretwars #0034 – Preparing Stage 4 entry for Toronto-Dominion Bank
On April 4, 2018
Secretwars #0033 – Stage 4 continuation for Canadian National Railway Co.
On April 3, 2018
Secretwars #0032 – Johnson & Johnson ready to take a Stage 4 slide!
On April 2, 2018
Secretwars #0031 – What is next for iShares Silver Trust?
On April 1, 2018
Secretwars #0030 – Stage 2 continuation for Freeport-McMoRan Copper & Gold Inc.
On March 31, 2018
Secretwars #0029 – McKesson Corp looking at Stage 4 drop!
On March 30, 2018
Secretwars #0028 – Possible Stage 4 for iShares S&P TSX Capped Financials Index Fund
On March 29, 2018
Secretwars #0027 – Stage 4 start for iShares MSCI Canada ETF
On March 28, 2018
Secretwars #0026 – Google’s turn to enter a stage 4 decline
On March 27, 2018
Secretwars #0025 – Revisiting Stage 4 candidate Advanced Micro Devices
On March 26, 2018
Secretwars #0024 – Stage 1 for iShares Dow Jones US Oil & Gas Ex Index
On March 25, 2018
Secretwars #0023 – Early Stage 4 in progress for Corning Inc.
On March 24, 2018
Secretwars #0022 – Bank of Montreal heading for a Stage 4 disaster?
On March 23, 2018
Secretwars #0021 – Tesla riding the edge of a Stage 4 cliff!
On March 22, 2018
Secretwars #0020 – Encana Corporation eyeing a Stage 2 breakout!
On March 21, 2018
Secretwars #0019 – Ambarella, Inc getting ready for a Stage 2 or 4
On March 20, 2018
Secretwars #0018 – Will Oracle continue to a Stage 2?
On March 19, 2018
Secretwars #0017 – Early Stage 2 for iPath S&P GSCI Crude Oil
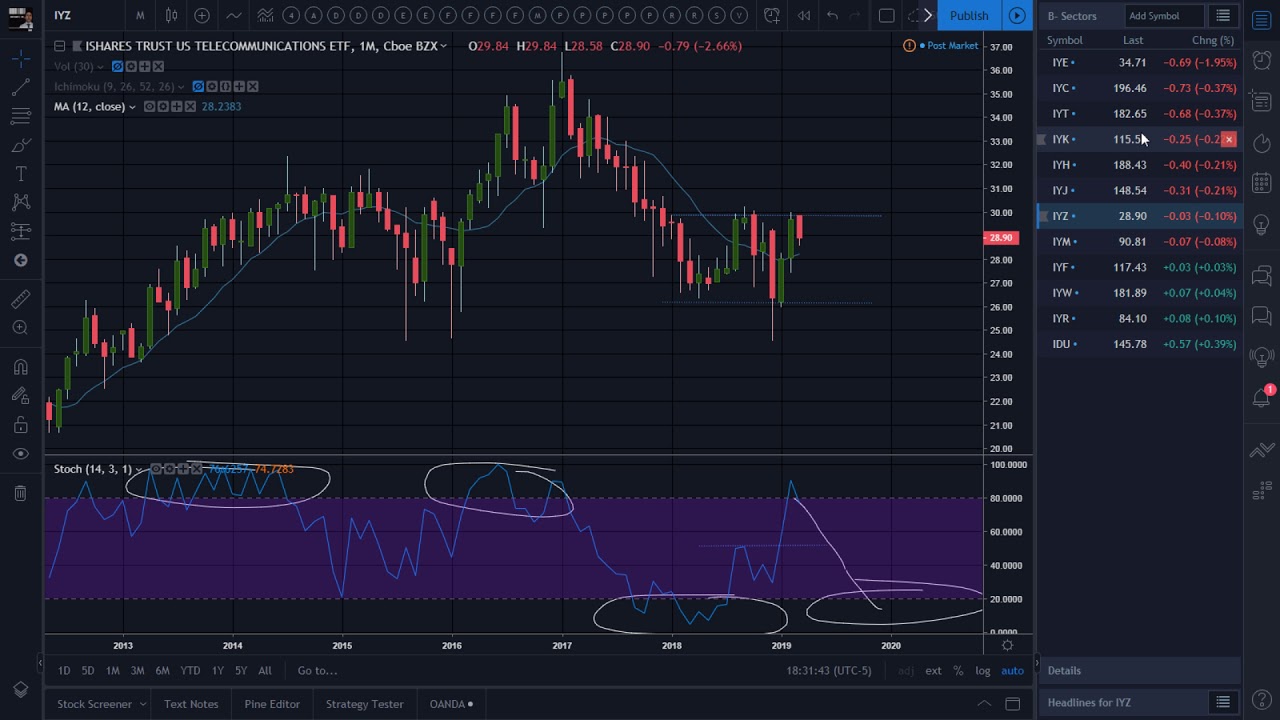
On March 18, 2018
Secretwars #0016 – Another Stage 4 for iShares U.S. Telecommunications ETF
On March 17, 2018
Secretwars #0015 – Stage 4 in progress for Thomson Reuters Corp
On March 16, 2018
Secretwars #0014 – Bank of America still in Stage 2
On March 15, 2018
Secretwars #0013 – Hasbro about to fall off a Stage 4 cliff!
On March 14, 2018
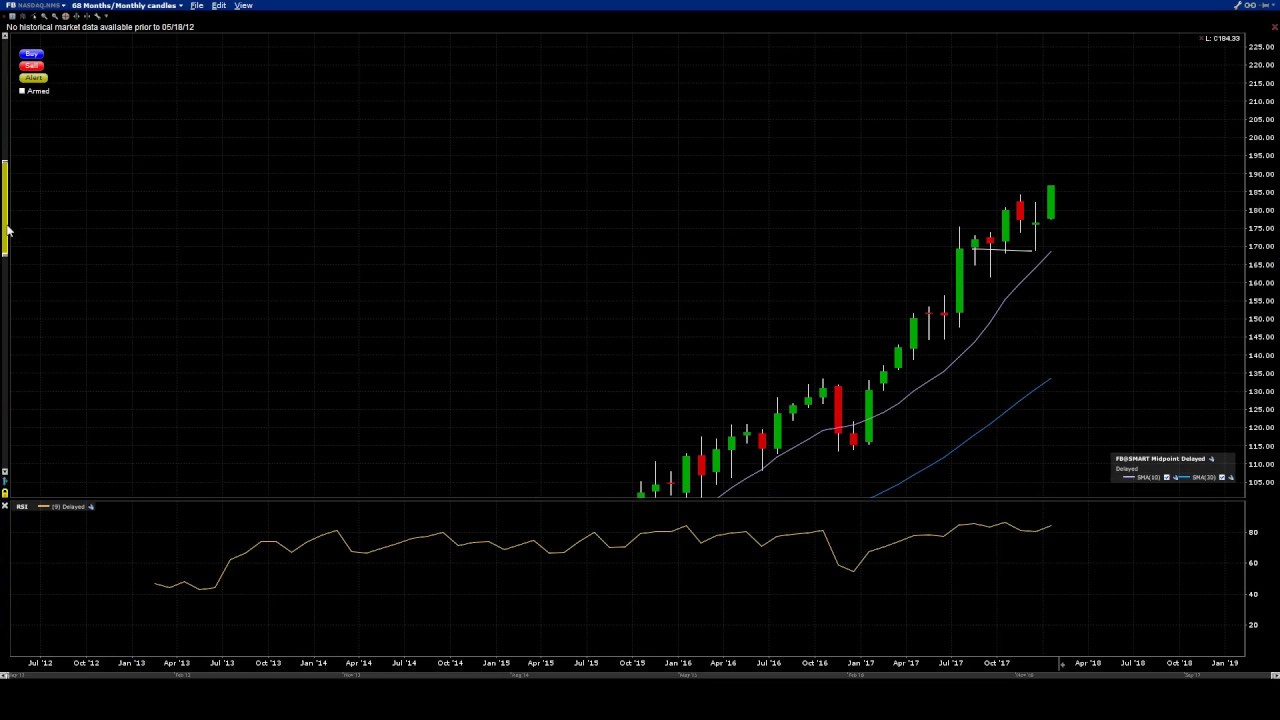
Secretwars #0012 – Will Facebook continue it’s Stage 2?
On March 13, 2018
Secretwars #0011 – Another Stage 2 candidate, Gilead Sciences Inc.
On March 12, 2018
Secretwars #0010 – Stage 2 continuation for Tableau Software Inc.
On March 11, 2018
Secretwars #0009 – TransCanada Corporation already in Stage 4
On March 10, 2018
Secretwars #0008 – Looks like a Stage 3 top for Bank of Nova Scotia
On March 9, 2018
Secretwars #0007 – Cheesecake Factory Inc ready to breakout in Stage 2!
On March 8, 2018
Secretwars #0006 – Advanced Micro Devices ready for Stage 4
On March 7, 2018
Secretwars #0005 – Stage 4 next for Toronto Stock Exchange Index?
On March 6, 2018
Secretwars #0004 – Blackberry still in Stage 2 uptrend
On March 5, 2018
Secretwars #0003 – Entering Stage 4 for General Motors Inc
On March 4, 2018
Secretwars #0002 – End of Stage 2 for Alibaba Group Holding Ltd
On March 3, 2018
Secretwars #0001 – Origins of Stan featuring Apple
On March 2, 2018
Badcharts #0065 – Canadian National Railway Co.
On March 1, 2018
Badcharts #0064 – Baytex Energy Corp.
On February 28, 2018
Badcharts #0063 – Fossil Group Inc.
On February 27, 2018
Badcharts #0062 – Enbridge Inc.
On February 26, 2018
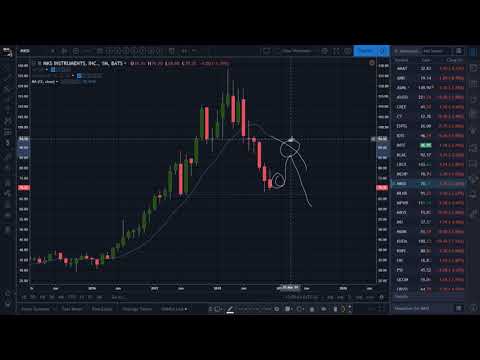
Badcharts #0061 – National Instruments Corp.
On February 25, 2018
Badcharts #0060 – Commvault Systems Inc.
On February 24, 2018
Badcharts #0059 – Home Depot Inc.
On February 23, 2018
Badcharts #0058 – Berkshire Hathaway Inc.
On February 22, 2018
Badcharts #0057 – New Zealand Dollar vs Canadian Dollar
On February 21, 2018
Badcharts #0056 – New Zealand Dollar vs Japanese Yen
On February 20, 2018
Badcharts #0055 – Great British Pound vs Japanese Yen
On February 19, 2018
Badcharts #0054 – Australian Dollar vs New Zealand Dollar
On February 18, 2018
Badcharts #0053 – New Zealand Dollar vs US Dollar
On February 17, 2018
Badcharts #0052 – Euro vs Great British Pound
On February 16, 2018
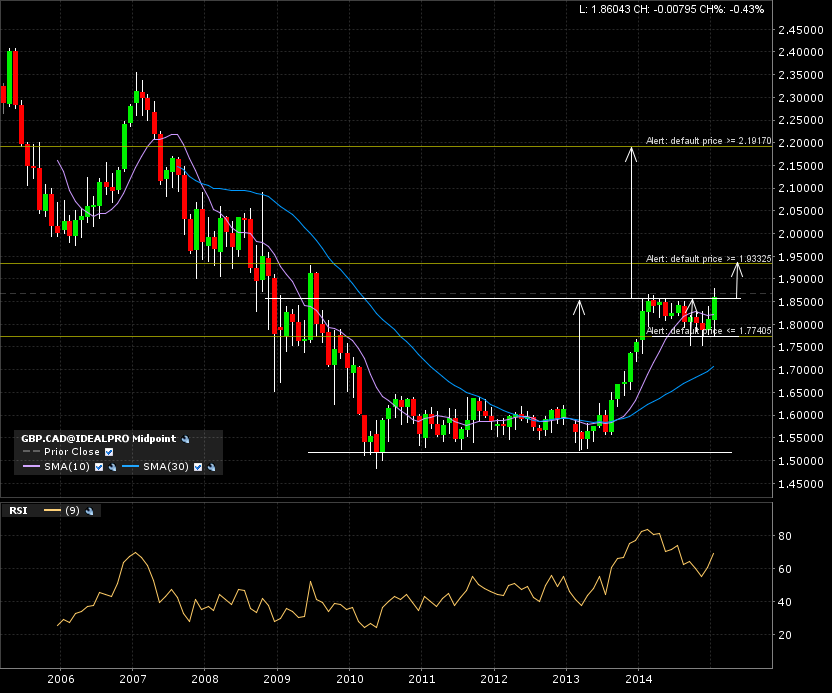
Badcharts #0051 – Great British Pound vs Canadian Dollar
On February 15, 2018
Badcharts #0050 – Great British Pound vs US Dollar
On February 14, 2018
Badcharts #0049 – The Priceline Group Inc.
On February 13, 2018
Badcharts #0048 – General Electric Co.
On February 12, 2018
Badcharts #0047 – A fast look at Stornoway Diamond Corporation
On February 11, 2018
Badcharts #0046 – Exxon Mobil Corporation
On February 10, 2018
The mastermind behind badcharts.com!
On February 10, 2018
Badcharts #0045 – Breakdown soon for Aussie vs Yen?
On February 9, 2018
Badcharts #0044 – CGI Group Inc.
On February 8, 2018
Badcharts #0043 – Eli Lilly & Company
On February 7, 2018
Badcharts #0042 – The Wendy’s Co.
On February 6, 2018
Badcharts #0041 – Qualcomm Incorporated
On February 5, 2018
Badcharts #0040 – American Airlines Group Inc.
On February 4, 2018
Badcharts #0039 – Pfizer Inc.
On February 3, 2018
Badcharts #0038 – Array BioPharma Inc.
On February 2, 2018
Badcharts #0037 – VanEck Vectors Coal ETF
On February 1, 2018
Badcharts #0036 – Breakout running with Nike?
On January 31, 2018
Badcharts #0035 – McKesson Corporation
On January 30, 2018
Badcharts #0034 – Aerospace Embraer SA
On January 29, 2018
Badcharts #0033 – Bombardier Inc.
On January 28, 2018
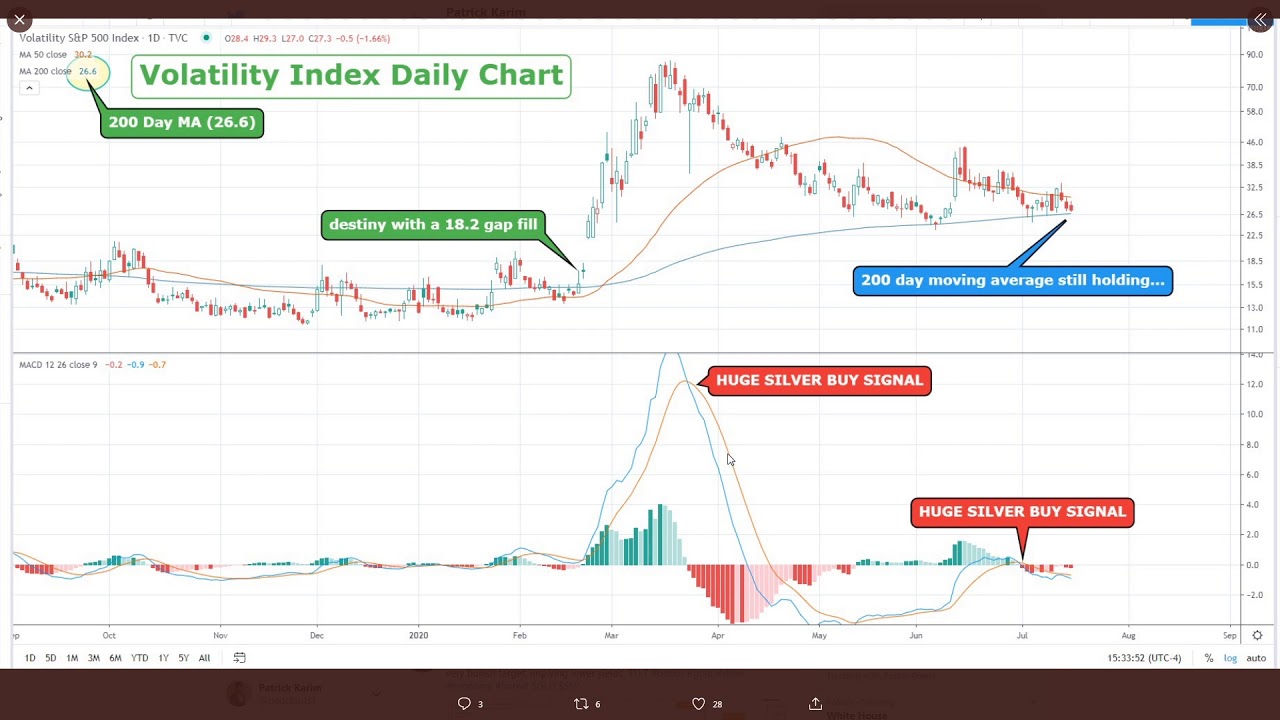
Badcharts #0032 – Volatility Index
On January 27, 2018
Badcharts #0031 – Gold US Dollar breaking out?
On January 26, 2018
Badcharts #0030 – NASDAQ Composite Index
On January 25, 2018
Badcharts #0029 – Toronto Stock Exchange Index
On January 24, 2018
Badcharts #0028 – New York Stock Exchange Index
On January 23, 2018
Badcharts #0027 – Walmart breaking out!
On January 22, 2018
Badcharts #0026 – US Dollar vs Yen
On January 21, 2018
Badcharts #0025 – Euro vs Loonie
On January 20, 2018
Badcharts #0024 – Noise reduction with Tesla
On January 19, 2018
Badcharts #0023 – Adobe Systems Incorporated
On January 18, 2018
Badcharts #0022 – Breakdown for US Dollar vs Loonie?
On January 17, 2018
Badcharts #0021 – Revisiting Cisco Systems Inc.
On January 16, 2018
Badcharts #0020 – Trending with Microsoft
On January 15, 2018
Badcharts #0019 – Deep diving with IBM
On January 14, 2018
Badcharts #0018 – Breakout for Twitter Inc.
On January 13, 2018
Badcharts #0017 – Intel breaking down
On January 12, 2018
Badcharts #0016 – Amazon’s wisdom
On January 11, 2018
Badcharts #0015 – Palo Alto Networks Inc.
On January 10, 2018
Badcharts #0014 – Covering Facebook
On January 9, 2018
Badcharts #0013 – Netflix chart review
On January 8, 2018
Badcharts #0012 – Micron Technology Inc.
On January 8, 2018
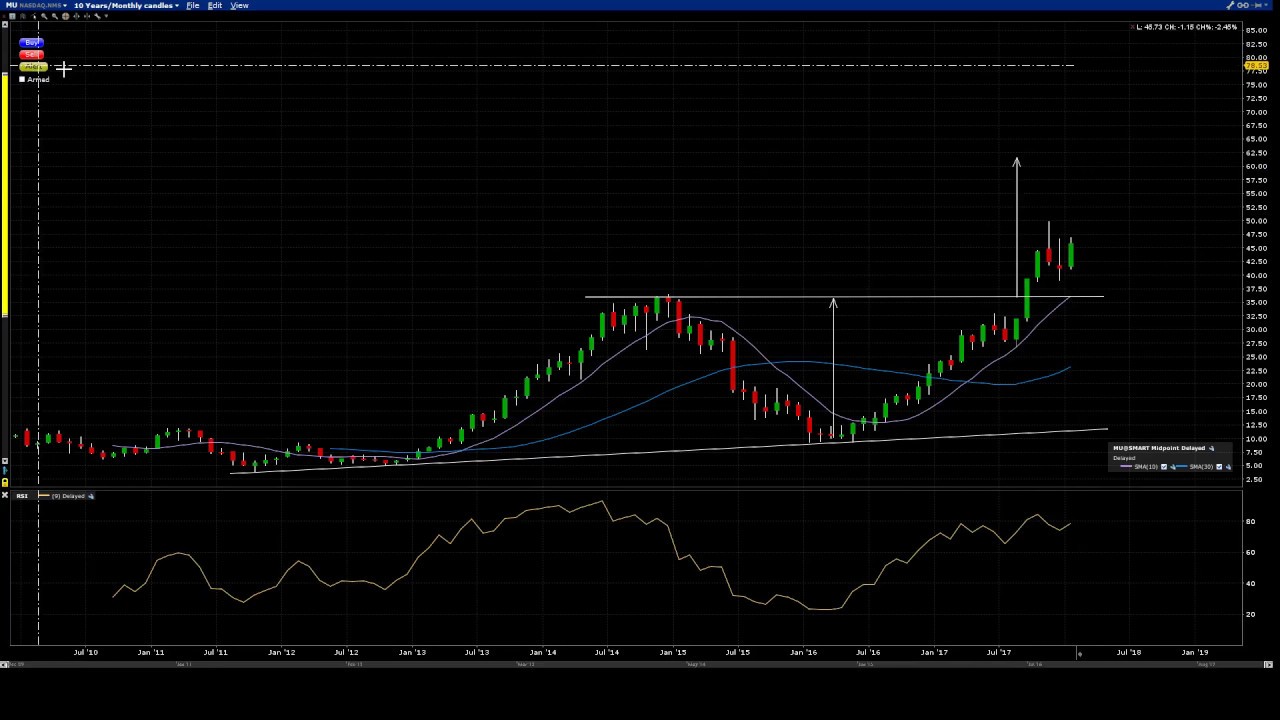
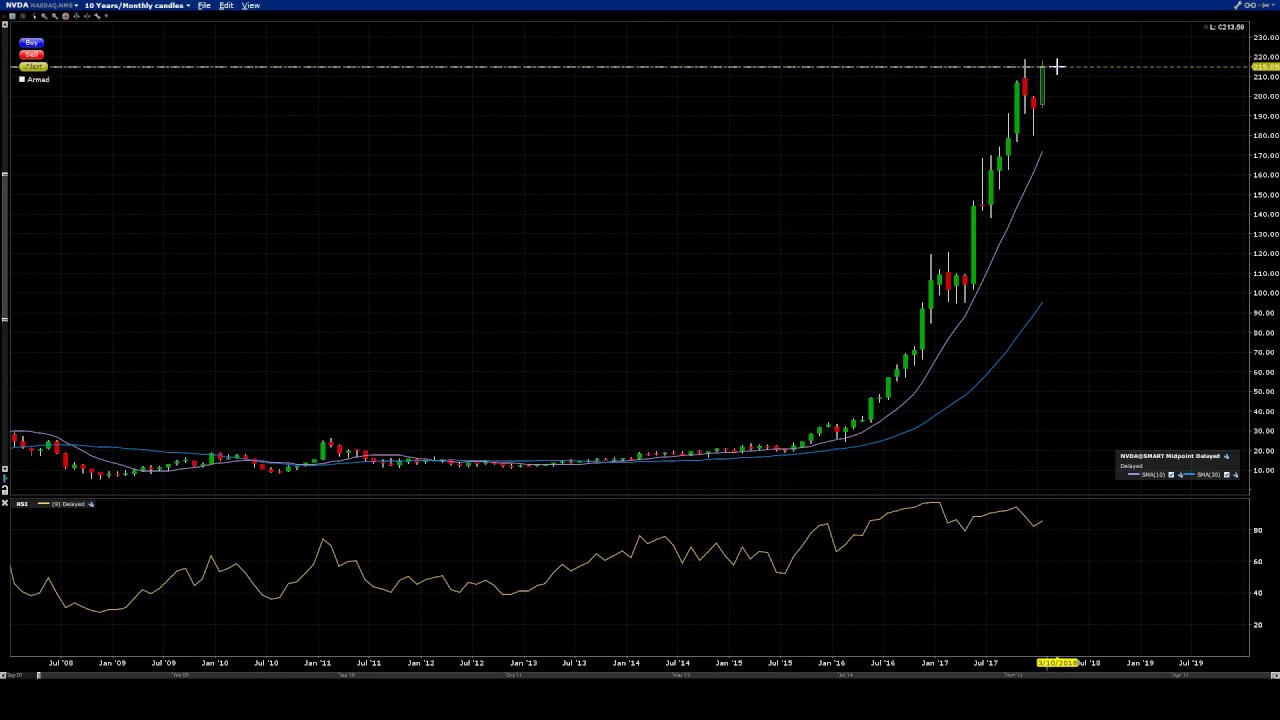
Badcharts #0011 – User request review for Nvidia
On January 6, 2018
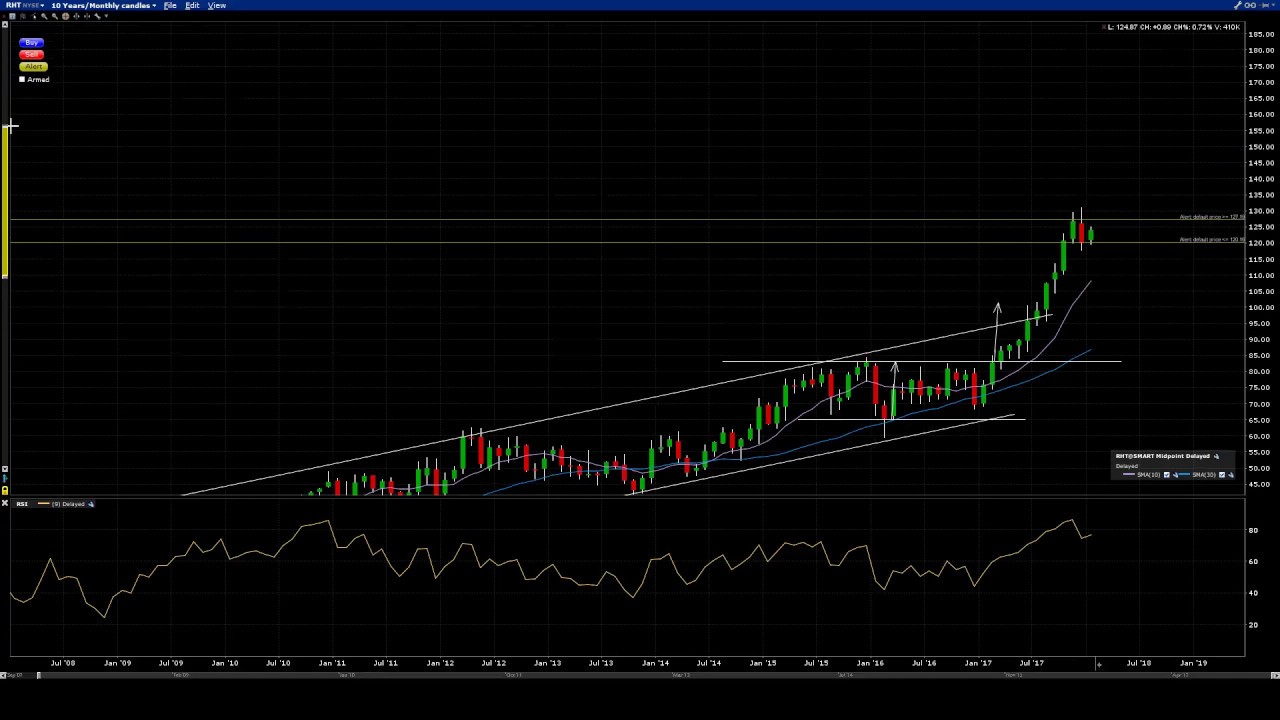
Badcharts #0010 – Outlook for Redhat in 2018
On January 5, 2018
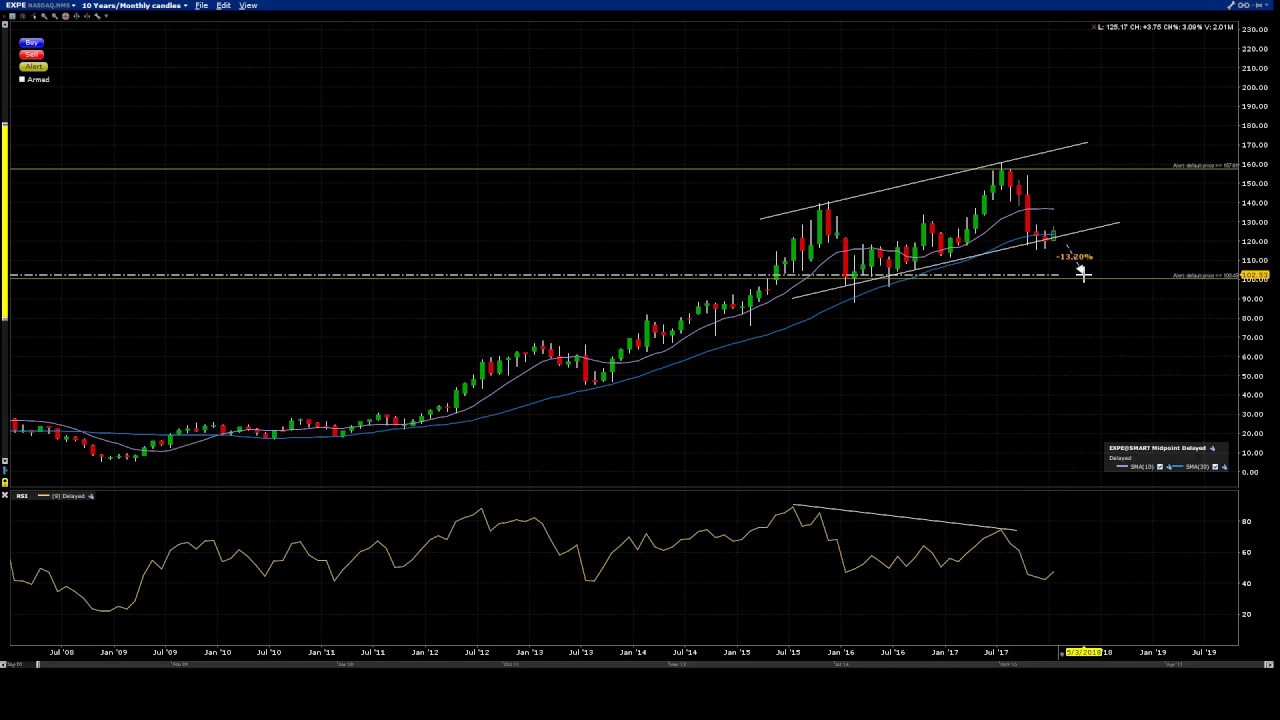
Badcharts #0009 – Will Expedia take off?
On January 4, 2018
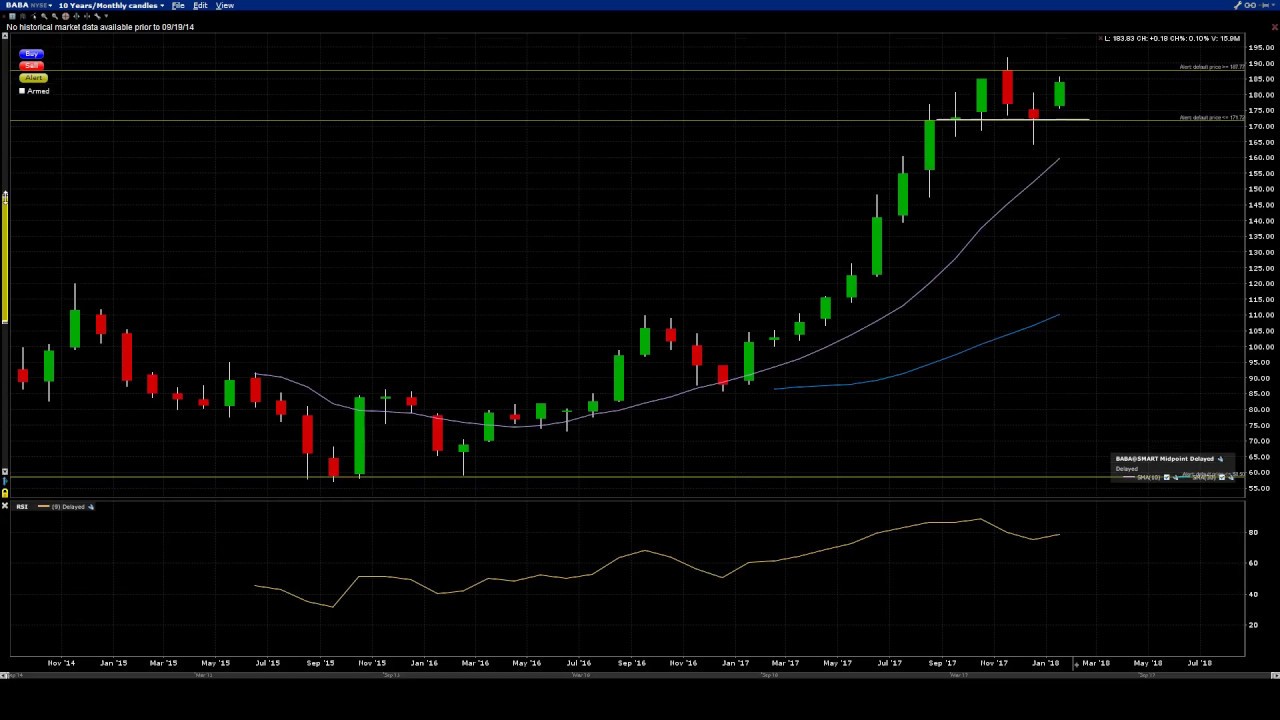
Badcharts #0008 – Looking at another request for BABA
On January 3, 2018
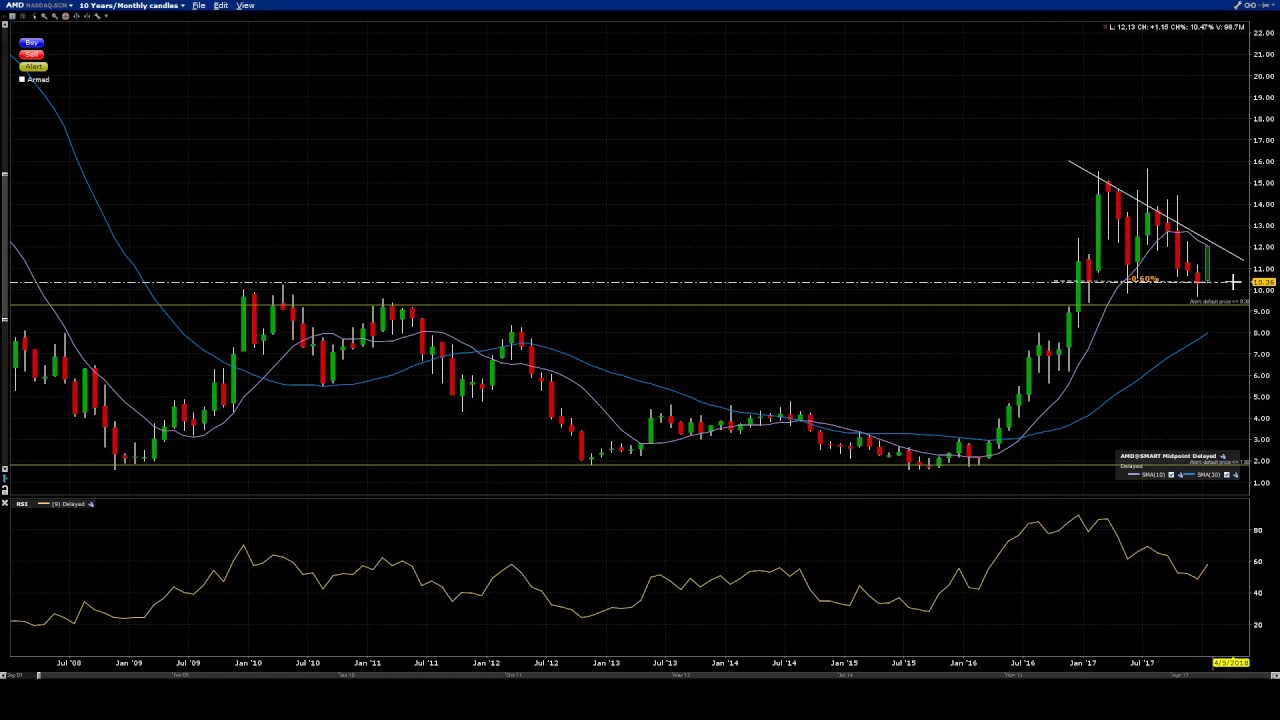
Badcharts #0007 – Got a Request to look at AMD
On January 3, 2018
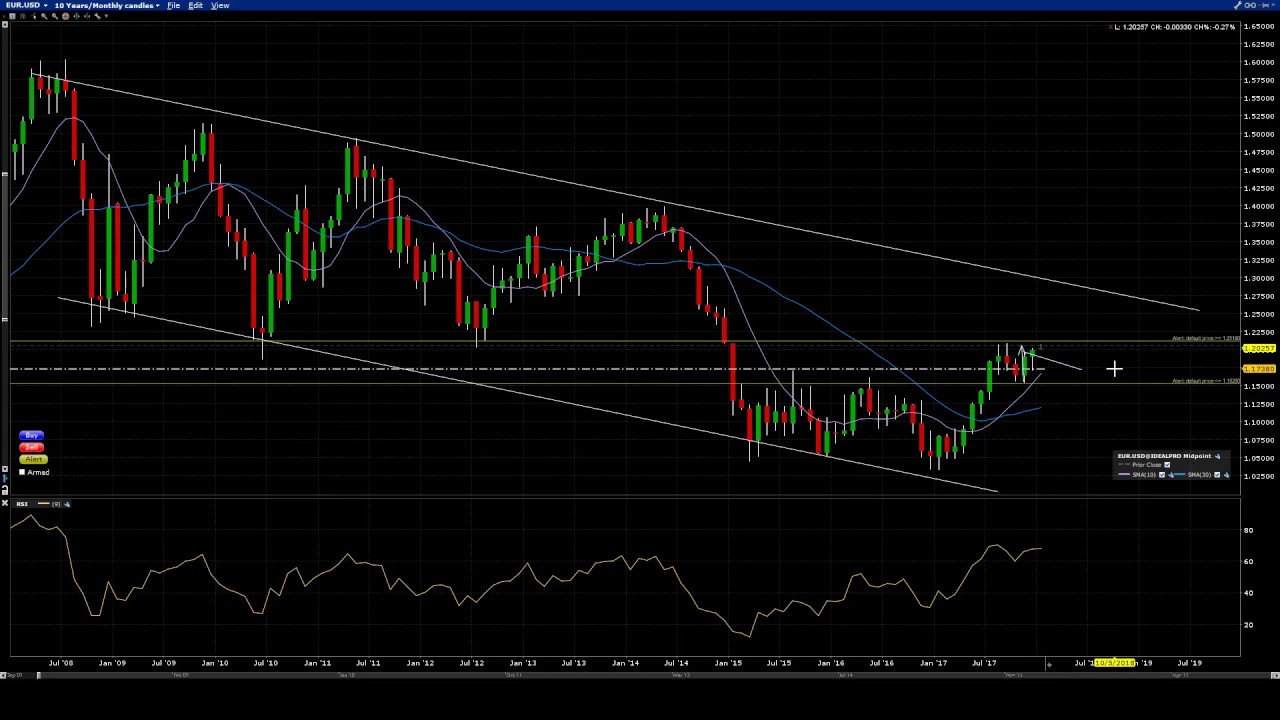
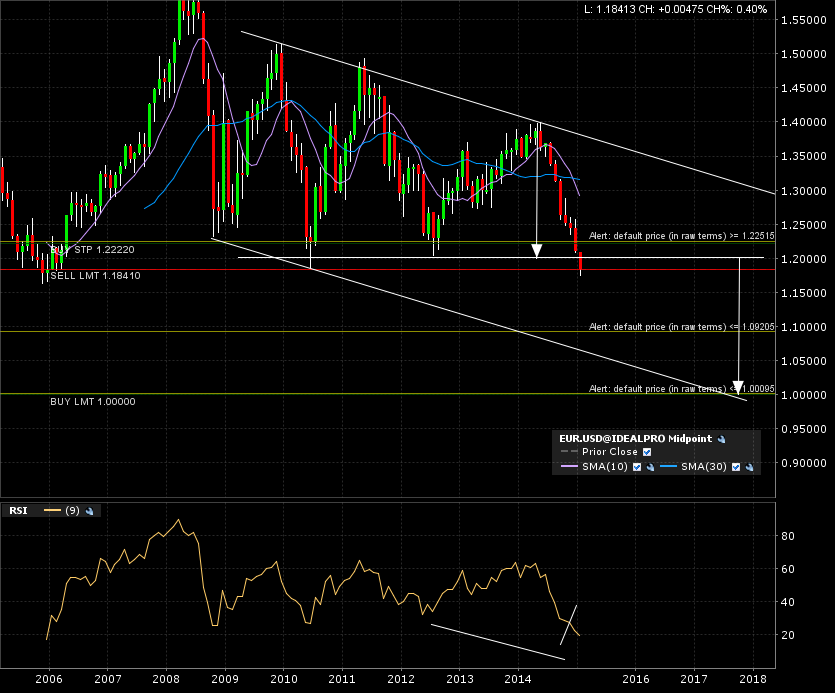
Badcharts #0006 – Reviewing Euro versus US Dollar
On January 2, 2018
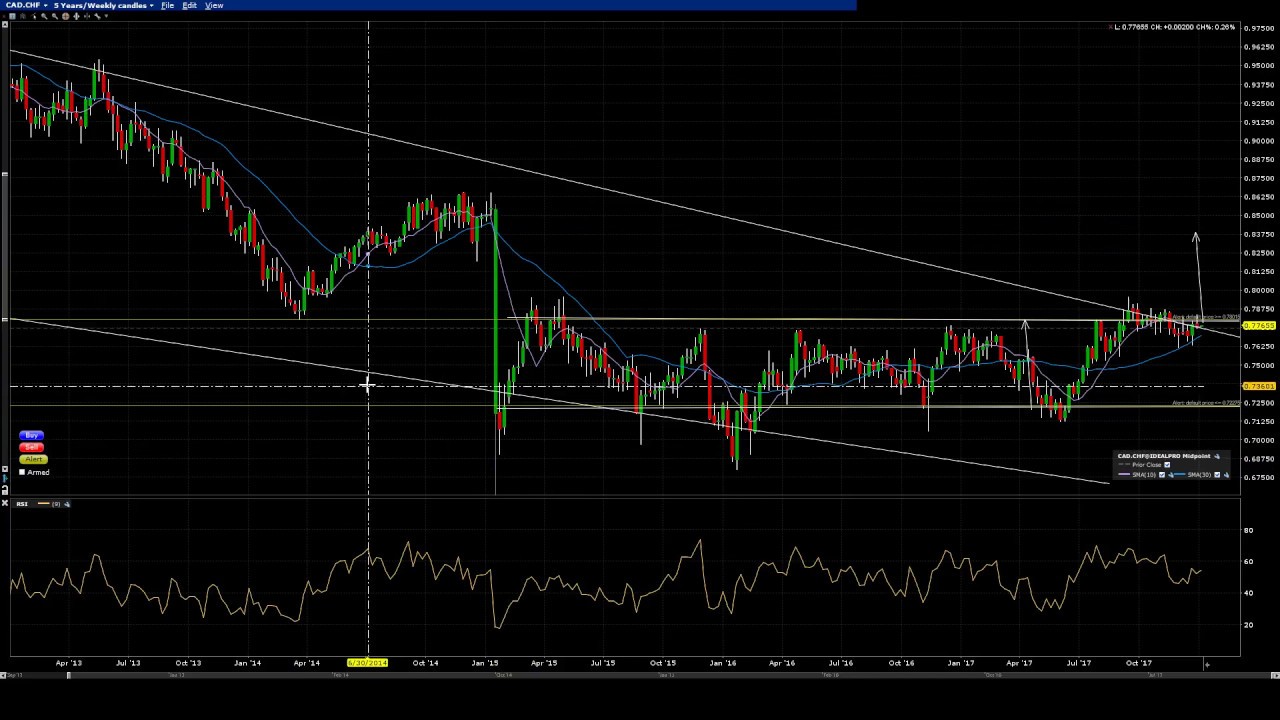
Badcharts #0005 – Can we play a breakout for Loonie vs Swiss Franc?
On January 1, 2018
Badcharts #0004 – Where will Blackberry go in 2018?
On December 31, 2017
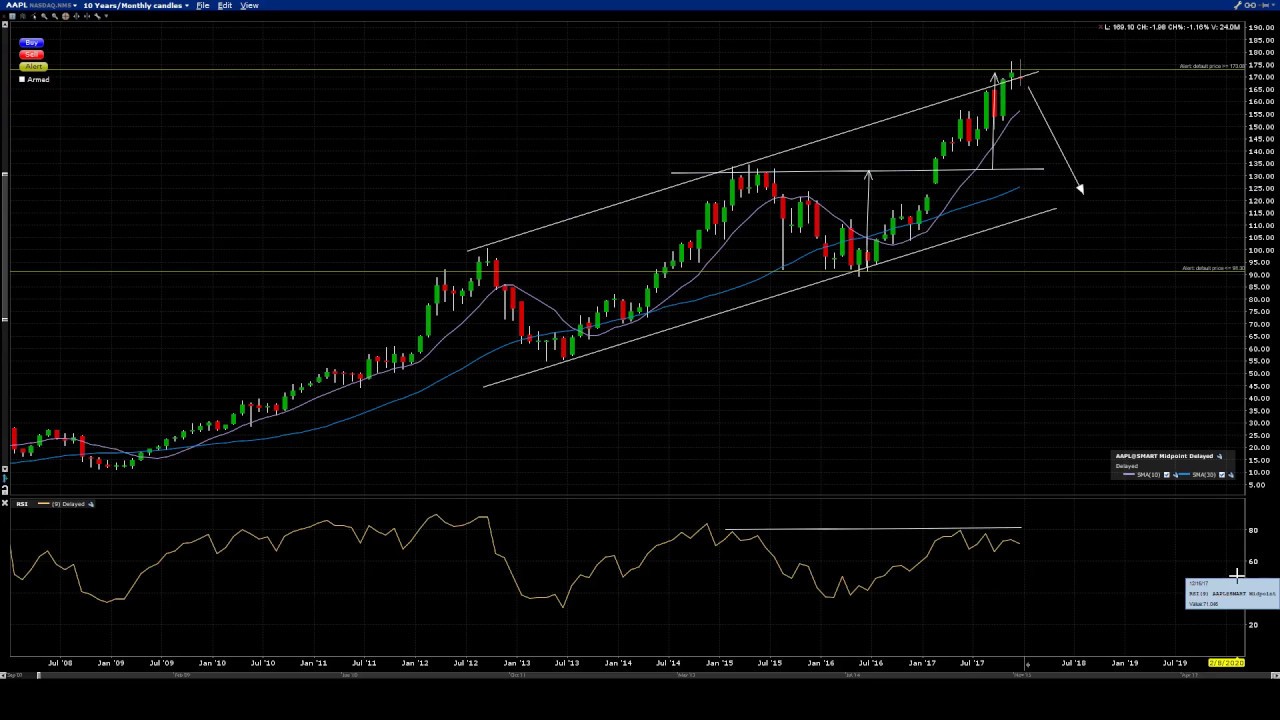
Badcharts #0003 – Refreshing my outlook on Apple.
On December 30, 2017
Badcharts #0002 – Visiting a triggered alert for Birchcliff Energy LTD
On December 27, 2017
Badcharts #0001 – US dollar vs Hong Kong dollar
On July 9, 2016
Descending channel for IBM.
On June 5, 2016
Viva Veeva! Go breakout Go!
On April 17, 2016
Will Delta lift Bombardier?
On March 27, 2016
Which way next for EURGBP?
On March 13, 2016
Australia leaving “Down Under” territory!
On March 6, 2016
Bottom’s UP for Glencore?
On February 27, 2016
Mister T!
On February 13, 2016
Gold getting some shine back?
On February 6, 2016
“I Don’t Want Your Love” says Ebay!
On January 25, 2016
usdcad vs crude oil vs gas pump price
On January 16, 2016
Japan vs The World!
On January 10, 2016
“All She Wants Is” breakout!
On January 10, 2016
EURCAD leaving “Planet Earth”?
On January 9, 2016
Another brick in the “WALL”.
On January 4, 2016
Yen getting “Serious” with Loonie!
On January 3, 2016
Back to an Ordinary World…
On November 8, 2015
The Wild Boys are back!
On October 25, 2015
Notorious QQQ.
On October 11, 2015
Save A Prayer for Blackberry!
On October 3, 2015
A Union of the Snake for Germany.
On September 27, 2015
New Moon on Monday for EURCAD!
On September 20, 2015
Will Apple Come Undone?
On September 19, 2015
Hungarian Forint is Hungry Like the Wolf!
On September 13, 2015
What a View To A Kill for Seattle Genetics!
On September 12, 2015
Restoration Hardware ready for The Reflex?
On September 7, 2015
About AUDNZD… Is There Something I Should Know?
On September 6, 2015
A probable possible bottom for EURGBP.
On September 4, 2015
The bearish way for AUDJPY.
On September 2, 2015
Ruble about to get a rumbling!
On September 1, 2015
Bringing the top down on Convertibles.
On August 31, 2015
Tire change for Canadian Tire?
On August 31, 2015
Dos cervezas, por favor!
On August 30, 2015
Getting SPDR S&P Retail at discount?
On August 29, 2015
Getting cold in Sweden!
On August 23, 2015
Will Cato Corp replay flash breakdown?
On August 23, 2015
Last twit for Twitter!
On August 22, 2015
Seeing the future with Oracle.
On August 22, 2015
Bigger and better descending channel for GM.
On August 16, 2015
Is it the end of line for Canadian Pacific Railway Limited?
On August 16, 2015
Weak link for LinkedIn?
On August 14, 2015
Signapore not singing so sweet!
On August 9, 2015
Top Formations & Oil & Gas Equipment & Services.
On August 9, 2015
Morphing with IBM.
On August 9, 2015
Indonesia getting close to Down Under.
On August 7, 2015
Regrouping with Groupon!
On August 2, 2015
Recharging Plug Power Inc.!
On August 1, 2015
Time for the Apple to fall off the tree?
On July 26, 2015
Model-Top for Ford Motor Co.?
On July 25, 2015
Slipping with Oil & Gas!
On July 22, 2015
United we fall…. with United Technologies Corp.
On July 19, 2015
Deep under water with SeaDrill Limited.
On July 16, 2015
Kiwis soon to leave London?
On July 15, 2015
The kiwi fell off the tree!
On July 12, 2015
Is Birchcliff Energy running out of gas?
On July 4, 2015
Multiple top in progress for High Yield Bond.
On July 2, 2015
Reversal of fortune for Tesla!
On July 1, 2015
Exxon Mobil Corporation on the verge of getting submerged!
On June 28, 2015
Eating souvlaki with GREK!
On June 26, 2015
SPDR S&P Homebuilders is high rising!
On June 23, 2015
Going high speed with the First Trust Dow Jones Internet Index.
On June 21, 2015
Yen about to Taoshimasu the Kiwi.
On June 16, 2015
Timberrrrr for Berkshire Hathaway Inc.
On June 14, 2015
Looking at the Aussie/Swiss forex pair.
On June 11, 2015
Up, up and away for Gilead Sciences Inc.
On June 10, 2015
Channeling with Halliburton Company.
On June 7, 2015
T for TOP?
On June 5, 2015
Swiss poking holes in the Kiwi!
On June 2, 2015
Misty mountain top for Malaysia.
On May 30, 2015
Capstone Turbine Corp. is sinking under water, gulp!
On May 28, 2015
Where does Veeva Systems go?
On May 25, 2015
HUGE move brewing for US Dollar vs YEN.
On May 21, 2015
Bottoming with VelocityShares 3x Long Crude ETN
On May 20, 2015
Going higher with Lowe!
On May 18, 2015
Keep on building with Home Depot.
On May 15, 2015
Next boot up for iShares MSCI Italy Index!
On May 14, 2015
Banks looking for a continuation breakout.
On May 13, 2015
Polo Ralph Lauren Corp. close to going under water!
On May 12, 2015
Where to hang Rackspace Hosting, Inc?
On May 11, 2015
Extinction for Fossil, Inc.?
On May 8, 2015
The “broader” picture for Broadcom Corp.
On May 7, 2015
Hitting the ocean’s bottom?
On May 5, 2015
Special K.
On May 4, 2015
What’s next for Tyson Foods Inc.?
On May 1, 2015
A bullish view for National Instruments Corporation.
On April 29, 2015
Getting high with iShares MSCI Netherlands!
On April 28, 2015
Using usdsgd to demonstrate “WALLS” consideration.
On April 27, 2015
Directv ready to breakout!
On April 23, 2015
“Super Size” for McDonald’s Corp.
On April 22, 2015
EMC Corporation seeking higher grounds!
On April 21, 2015
Way-back machine: IBM circa 2008.
On April 20, 2015
The Coca-Cola Company ready to get KO’d!
On April 17, 2015
Hey Philip Morris, got a smoke?
On April 16, 2015
Comeback for the Bank of America Corporation.
On April 15, 2015
Golden with The Goldman Sachs Group Inc.
On April 14, 2015
Time to buy Best Buy?
On April 13, 2015
Watching a movie with Netflix.
On April 12, 2015
Power surge for General Electric Co.
On April 11, 2015
What is on the horizon for Verizon?
On April 10, 2015
Guggenheim Solar going to get a good TAN!
On April 9, 2015
What is next for Canadian Natural Resources Limited?
On April 8, 2015
Using Exxon Mobil Corporation to demonstrate “chart morphing”.
On April 7, 2015
Japan Small Cap breaking out!
On April 6, 2015
Electronic Arts… it’s in the game!
On April 3, 2015
Hitting a wall with Walmart!
On April 1, 2015
Round 3 for Blackberry.
On March 31, 2015
Breakout for S&P China ETF.
On March 30, 2015
Has Tesla Motors topped out?
On March 27, 2015
ERROR: Out of memory for SanDisk Corp.
On March 25, 2015
ISHARES Global Financials ETF poised for continuation breakout.
On March 24, 2015
Valent Pharmaceuticals going parabolic!
On March 23, 2015
Requested analysis for Encana Corp.
On March 22, 2015
Toyota breaking out!
On March 20, 2015
Just doing it with Nike!
On March 18, 2015
Blue screen for Microsoft?
On March 17, 2015
Where is CGI at?
On March 16, 2015
My bear called IBM.
On March 15, 2015
Following up on Google.
On March 13, 2015
Breakdown alert triggered for gbpusd.
On March 12, 2015
What’s happening with the “rectangle for euro and kiwi”?
On March 11, 2015
Where is my birthday cake?
On March 10, 2015
Topping out with Johnson & Johnson.
On March 8, 2015
The next “real” move for the US Dollar.
On March 6, 2015
Taking a look at Fiera Capital Corp.
On March 5, 2015
Citigroup gonna be a big boy soon!
On March 4, 2015
Reset in progress for CommVault Systems Inc.
On March 3, 2015
Ambarella doesn’t need an umbrella!
On March 2, 2015
Micron going micro?
On March 1, 2015
Testing resistance with Splunk!
On February 27, 2015
Breakout for Novavax, Inc
On February 26, 2015
Cisco Heat!
On February 25, 2015
Oil still on a slippery slope.
On February 24, 2015
A peek at silver.
On February 23, 2015
Angie’s List going to heaven?
On February 21, 2015
My dog named Russell. Fetch!
On February 20, 2015
What is the next move for EURAUD?
On February 19, 2015
Power in the Nasdaq 100!
On February 18, 2015
Monthly payment due for American Express.
On February 17, 2015
Growing pains soon over for Agrium?
On February 16, 2015
Potash is fertilized and ready to grow!
On February 15, 2015
The enemy of my enemy is my friend.
On February 14, 2015
Taking another peek at Blackberry.
On February 13, 2015
Will Great Britain continue invading Mexico?
On February 12, 2015
Kiwis invading Australia!
On February 11, 2015
GM exiting descending channel.
On February 10, 2015
Where we at with eurcad?
On February 9, 2015
A rectangle for euro and kiwi.
On February 8, 2015
Kiwis in London!
On February 7, 2015
Diamonds are forever.
On February 7, 2015
A tool of the trade.
On February 6, 2015
Stressed out? Here is some help!
On February 5, 2015
Pound’ing for the Aussie?
On February 4, 2015
A which-way book told by AUDJPY.
On February 3, 2015
BIG consolidation in progress for China!
On February 3, 2015
Got Gemalto?
On February 2, 2015
Taking a bite on Apple.
On February 1, 2015
All you need is a little patience.
On January 30, 2015
Xerox fresh out of copies? Maybe not!
On January 29, 2015
No man’s land for Yahoo Inc.
On January 29, 2015
Is Caterpillar digging itself a hole?
On January 28, 2015
Cooking period for Microsoft Corp.?
On January 28, 2015
Corning Inc. breaking out!
On January 28, 2015
Something is UP with Pfizer?
On January 27, 2015
How to quiet the noisiest chart.
On January 26, 2015
Emerging Markets, not emerging anymore?
On January 25, 2015
Euro VS Yen. Round 1, Fight!
On January 25, 2015
GBPUSD close to breaking down, but to where?
On January 25, 2015
US Dollar versus China Offshore Yuan.
On January 25, 2015
The “bigger” picture for USDCAD.
On January 25, 2015
A cup and handle for Array BioPharma, Inc.
On January 24, 2015
What do Starbucks and Cialis have in common?
On January 24, 2015
Breakout soon for Blackberry?
On January 23, 2015
Eli Lilly and Company… riding HARD!
On January 22, 2015
Loonie ready to get “Pound-ed”?
On January 22, 2015
Using eurhuf to demonstrate “noise reduction” power of the monthly close.
On January 22, 2015
Canada made in Japan.
On January 22, 2015
Oh Canada!
On January 21, 2015
United we stand…. with United Technologies Corp.
On January 20, 2015
Drawing lines with Boeing Airlines.
On January 19, 2015
Let’s get physical… with gold!
On January 18, 2015
Consolidation in progress for Ebay and Facebook.
On January 18, 2015
Will Google follow IBM’s breakdown?
On January 17, 2015
Will the kiwi fall off the tree?
On January 16, 2015
Bombs away… with Bombardier!
On January 15, 2015
What now after the Swiss Shuffle?
On January 14, 2015
Case study using eurgbp: Considerations while establishing profit targets (PART 2).
On January 14, 2015
Case study using Amazon: Considerations while establishing profit targets (PART 1).
On January 12, 2015
CGI group Inc. testing upper resistance for an eventual breakout?
On January 11, 2015
Continuing with eurusd to demonstrate risk and money management.
On January 10, 2015
Using eurusd to demonstrate “Top to bottom” approach.